The Invisible World Revealed by Light!
MAKE IT
SEE IT

STUDY IT
Scroll down, continue exploring
↓
Welcome to My Lab!
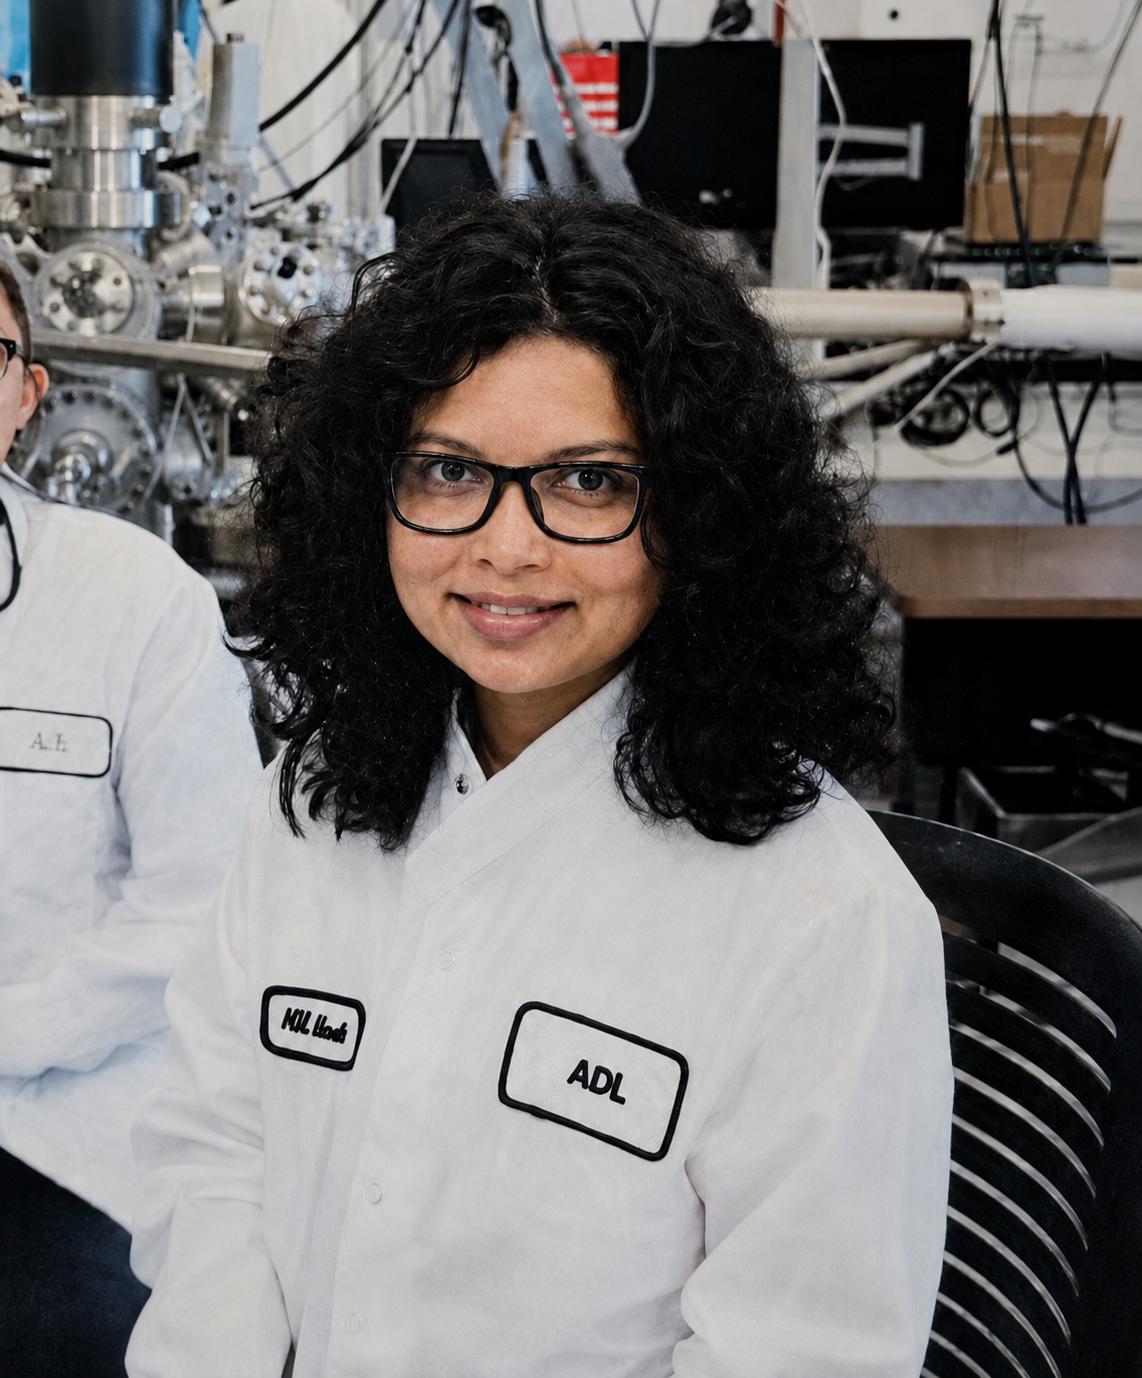
Hi! I’m Nilupa.
I am a PhD student in physics at Binghamton University.
My research centers on synthesizing and characterizing atomically thin materials.
Beyond the lab, I am passionate about science communication. I love finding creative ways to make science easy to understand, engaging, and exciting for everyone.
That is why I created this webpage! I wanted to build a place where you can step into my world and get a front-row seat to my everyday work in the lab.
Whether you are a fellow researcher, a student, or just curious about science, come along; you can explore what my daily routine looks like—from making thin crystals in a furnace to uncovering their hidden properties with lasers.
Let’s begin!
Section 1
What Am I Making?
Meet the teeny-tiny triangles, three atoms thick

For the last four years, I have been making extremely thin materials called transition metal dichalcogenide sheets, or TMD sheets—they’re so small, you can’t see them with the naked eye!
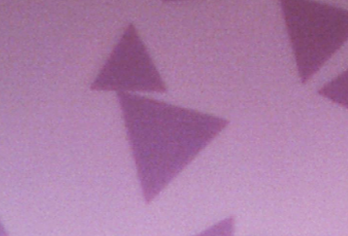
Under a microscope, they often look like tiny triangles.
Not only are they small, but they are also incredibly thin. One triangular sheet is only three atomic layers thick.

To put that into perspective, one sheet is 100,000 times thinner than a strand of human hair. A single sheet contains only three layers of atoms.
Now you might wonder, why get excited about something so small?
These sheets may be only three atoms thick, but they can absorb light, emit it, and carry electrical signals. Researchers are exploring how these abilities could help create tiny light detectors, flexible sensors, and smaller electronic components.
Imagine a sensor that bends with your clothing or a component that responds when light falls on it. Before we can put these materials to work, we need to understand how they behave—and that is where my research comes in.
As an experimental researcher, I test different ways to make these sheets and then study how they behave. By uncovering their unique properties, I help build the scientific foundation that engineers and technology developers can use to design future devices.
Section 2
Making the TMD Sheet
Cooking crystals inside a hot furnace
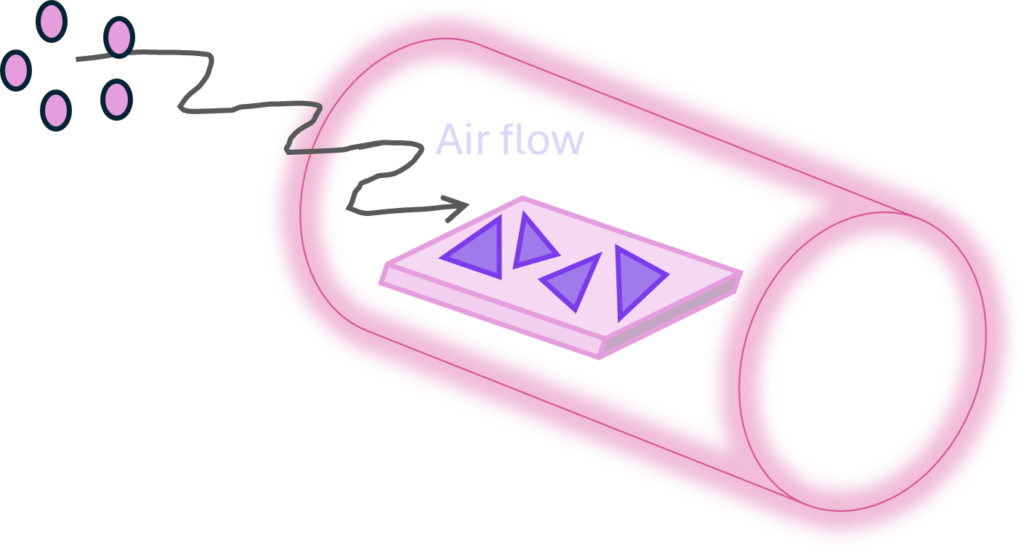
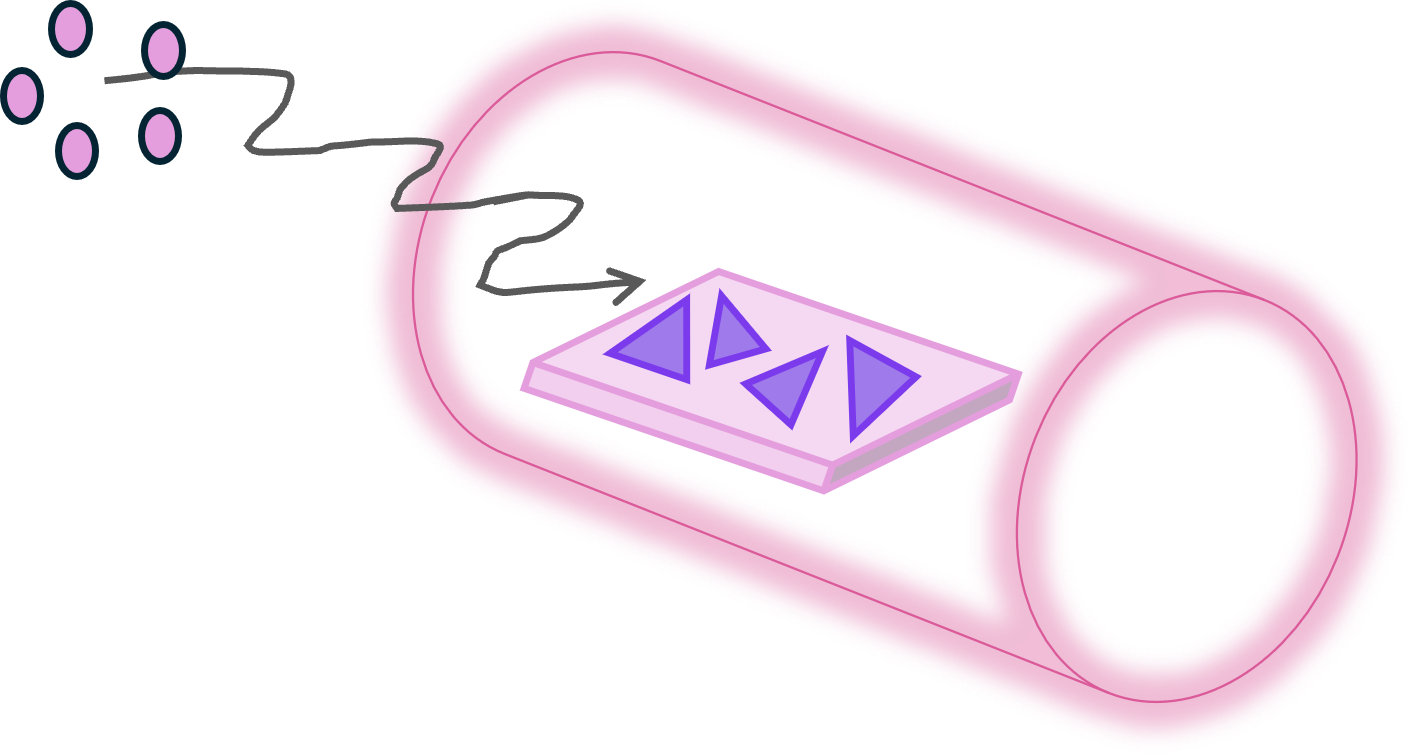
To grow these sheets, I basically cook them in a very hot furnace using a method called chemical vapor deposition, or CVD.
First, I take a long cylindrical quartz tube. It’s clear like glass, but quartz better withstands the high temperatures required for the experiment.

Next, I prepare a small silicon chip. It is a tiny, flat square with a smooth, shiny surface. This chip is the surface on which I want my TMD sheets to grow. (Scientists call this the “substrate.”)

I then prepare small amounts of the starting materials, called precursors. The precursors are going to fuse to make my TMD sheets. One precursor supplies the metal atoms, such as Molybdenum (Mo). Another supplies the chalcogen atoms, such as Sulfur (S). The powders are carefully placed in a small heat-resistant ceramic boat inside the quartz tube.
Now it is time to heat things up.
I place the quartz tube inside a furnace and connect it to the gas lines. A carefully controlled gas flows through the tube during the experiment.
As the furnace heats up, metal atoms and sulfur atoms turn into gases. The flowing gas carries this vapor through the tube and toward the silicon chip.
When the vapor reaches the chip, metal and sulfur atoms meet and begin arranging themselves into a thin sheet.

At first, teeny-tiny crystal islands begin to form. As more atoms arrive, the islands grow larger. If the conditions are just right, they develop into those triangular, atom-thin TMD sheets we just talked about.
But growing a good sheet is not easy. Small changes in temperature, gas flow, precursor amount, growth time, or the condition of the silicon surface can completely change the result.
One experiment might produce large, beautiful triangles. Another might produce sheets that are very small, too thick, crowded together, or irregularly shaped.
Over the years, I have grown hundreds of samples, and that is why I grow so many. Each experiment gives me new clues about what worked and what did not.
It is a little like adjusting a recipe. By carefully changing one condition at a time, I learn how to make larger, cleaner, more uniform TMD sheets.
Section 3
Examining the Samples
From Images to Insights
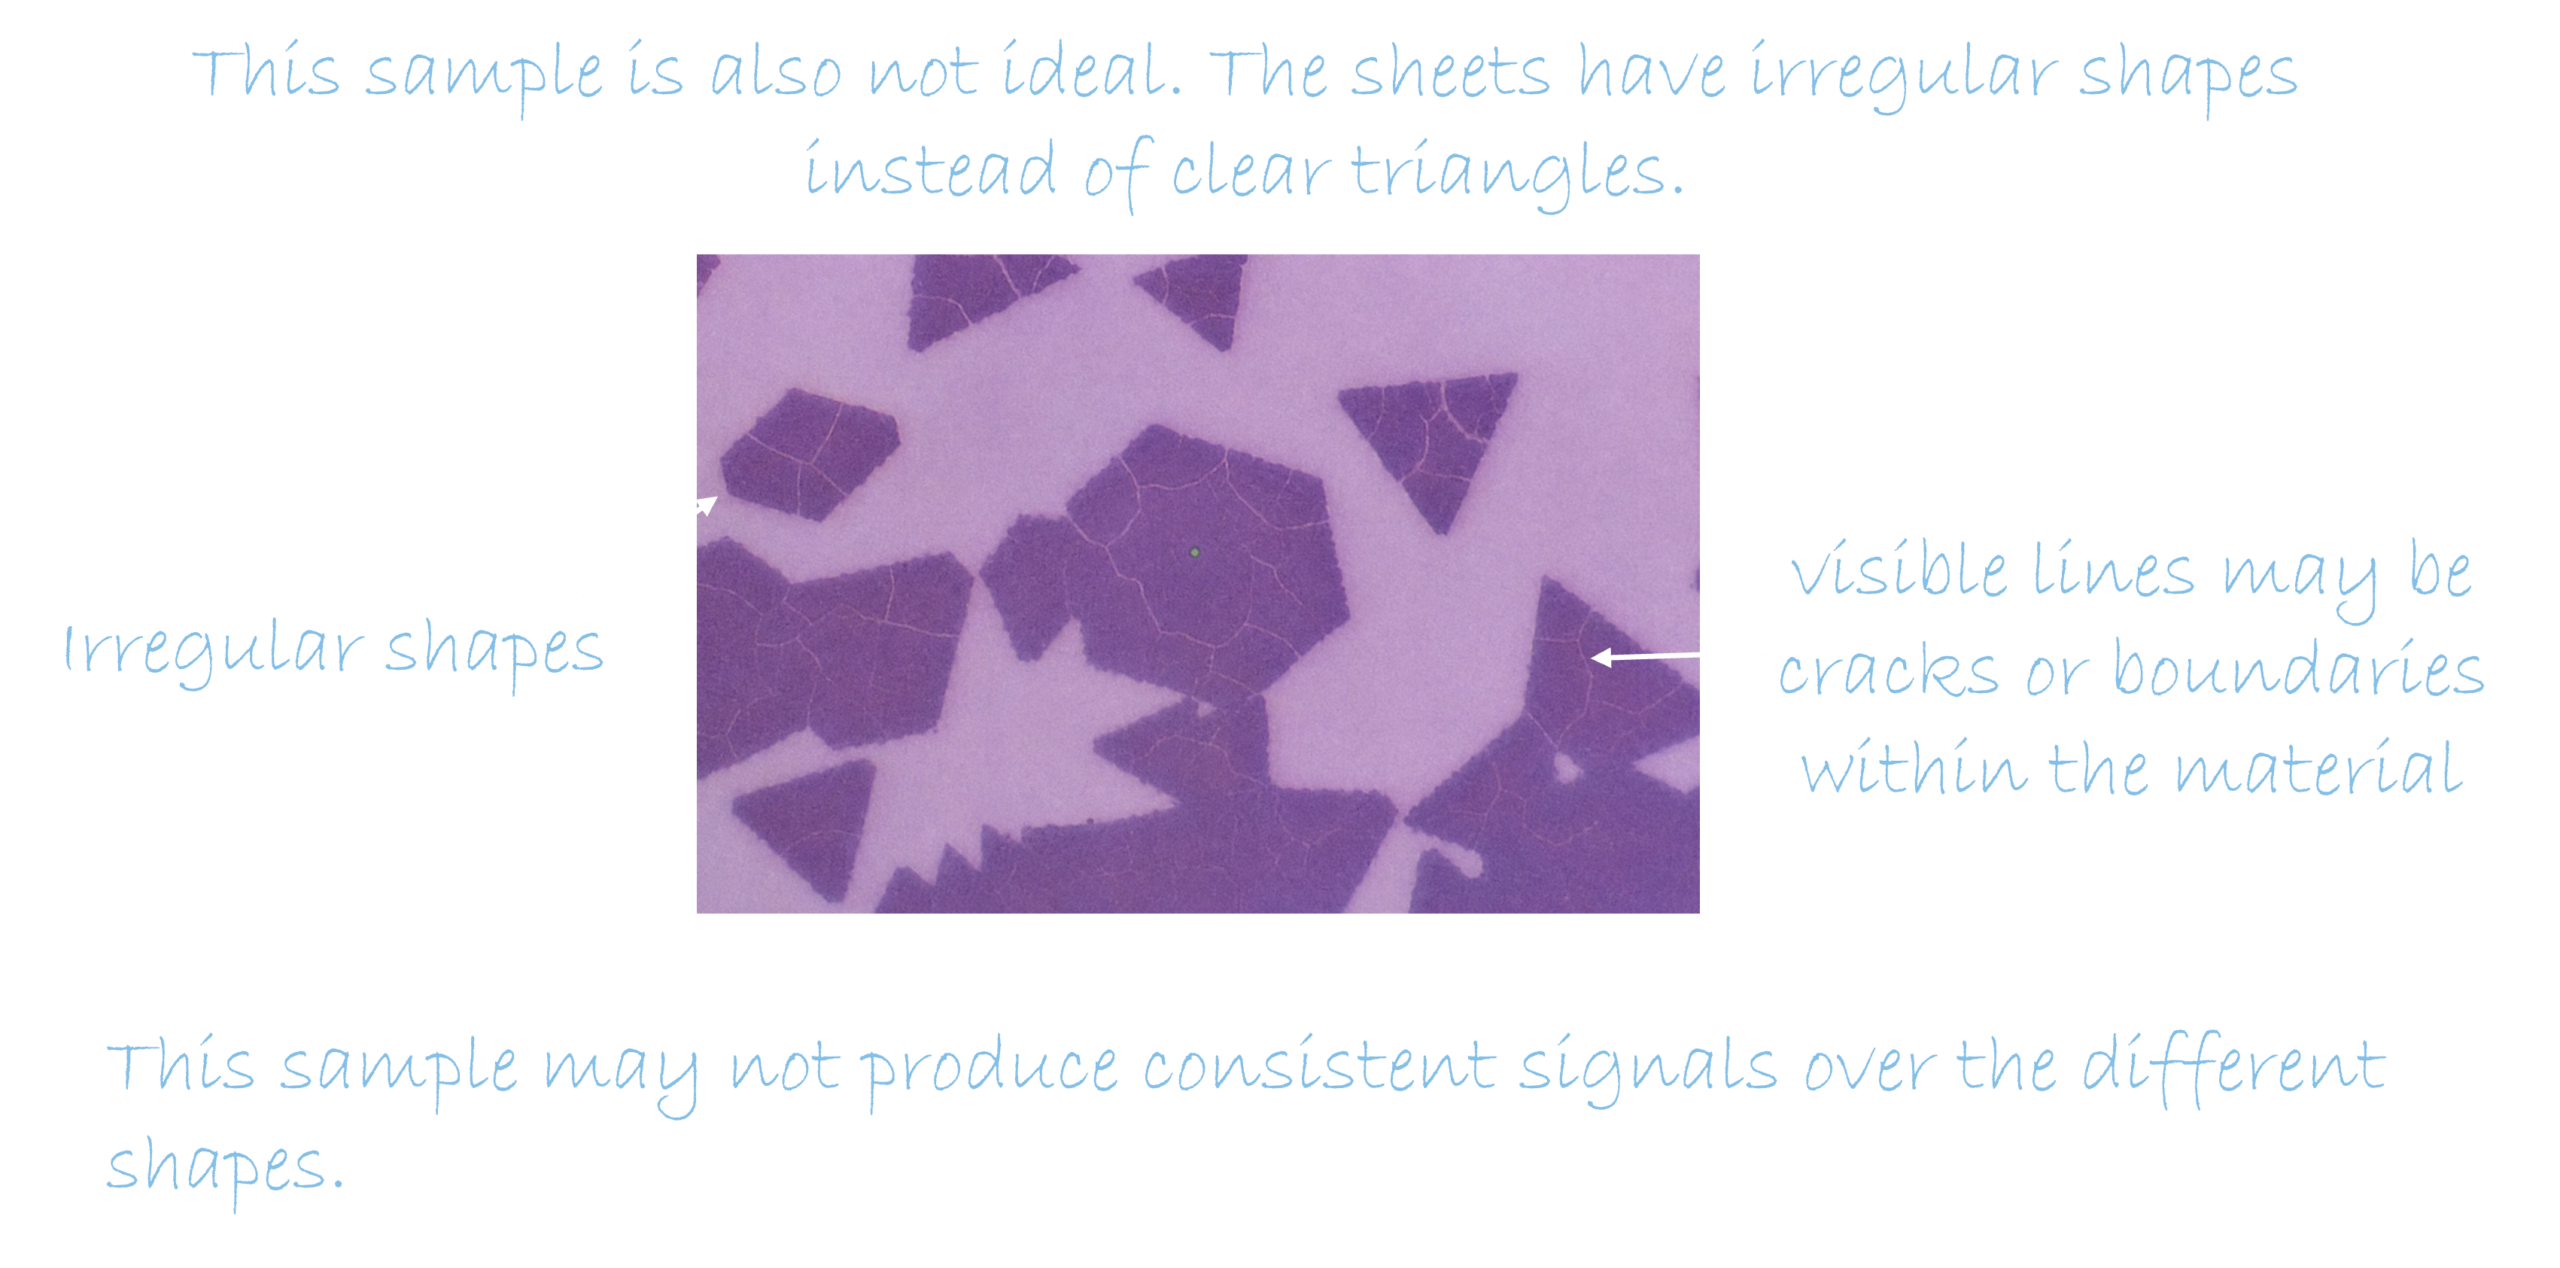
Now that we know how to make a sample with TMD sheets on it, let’s learn how to examine the samples.
As I mentioned, the triangles are too small to see with the naked eye, so I use a microscope to examine them.
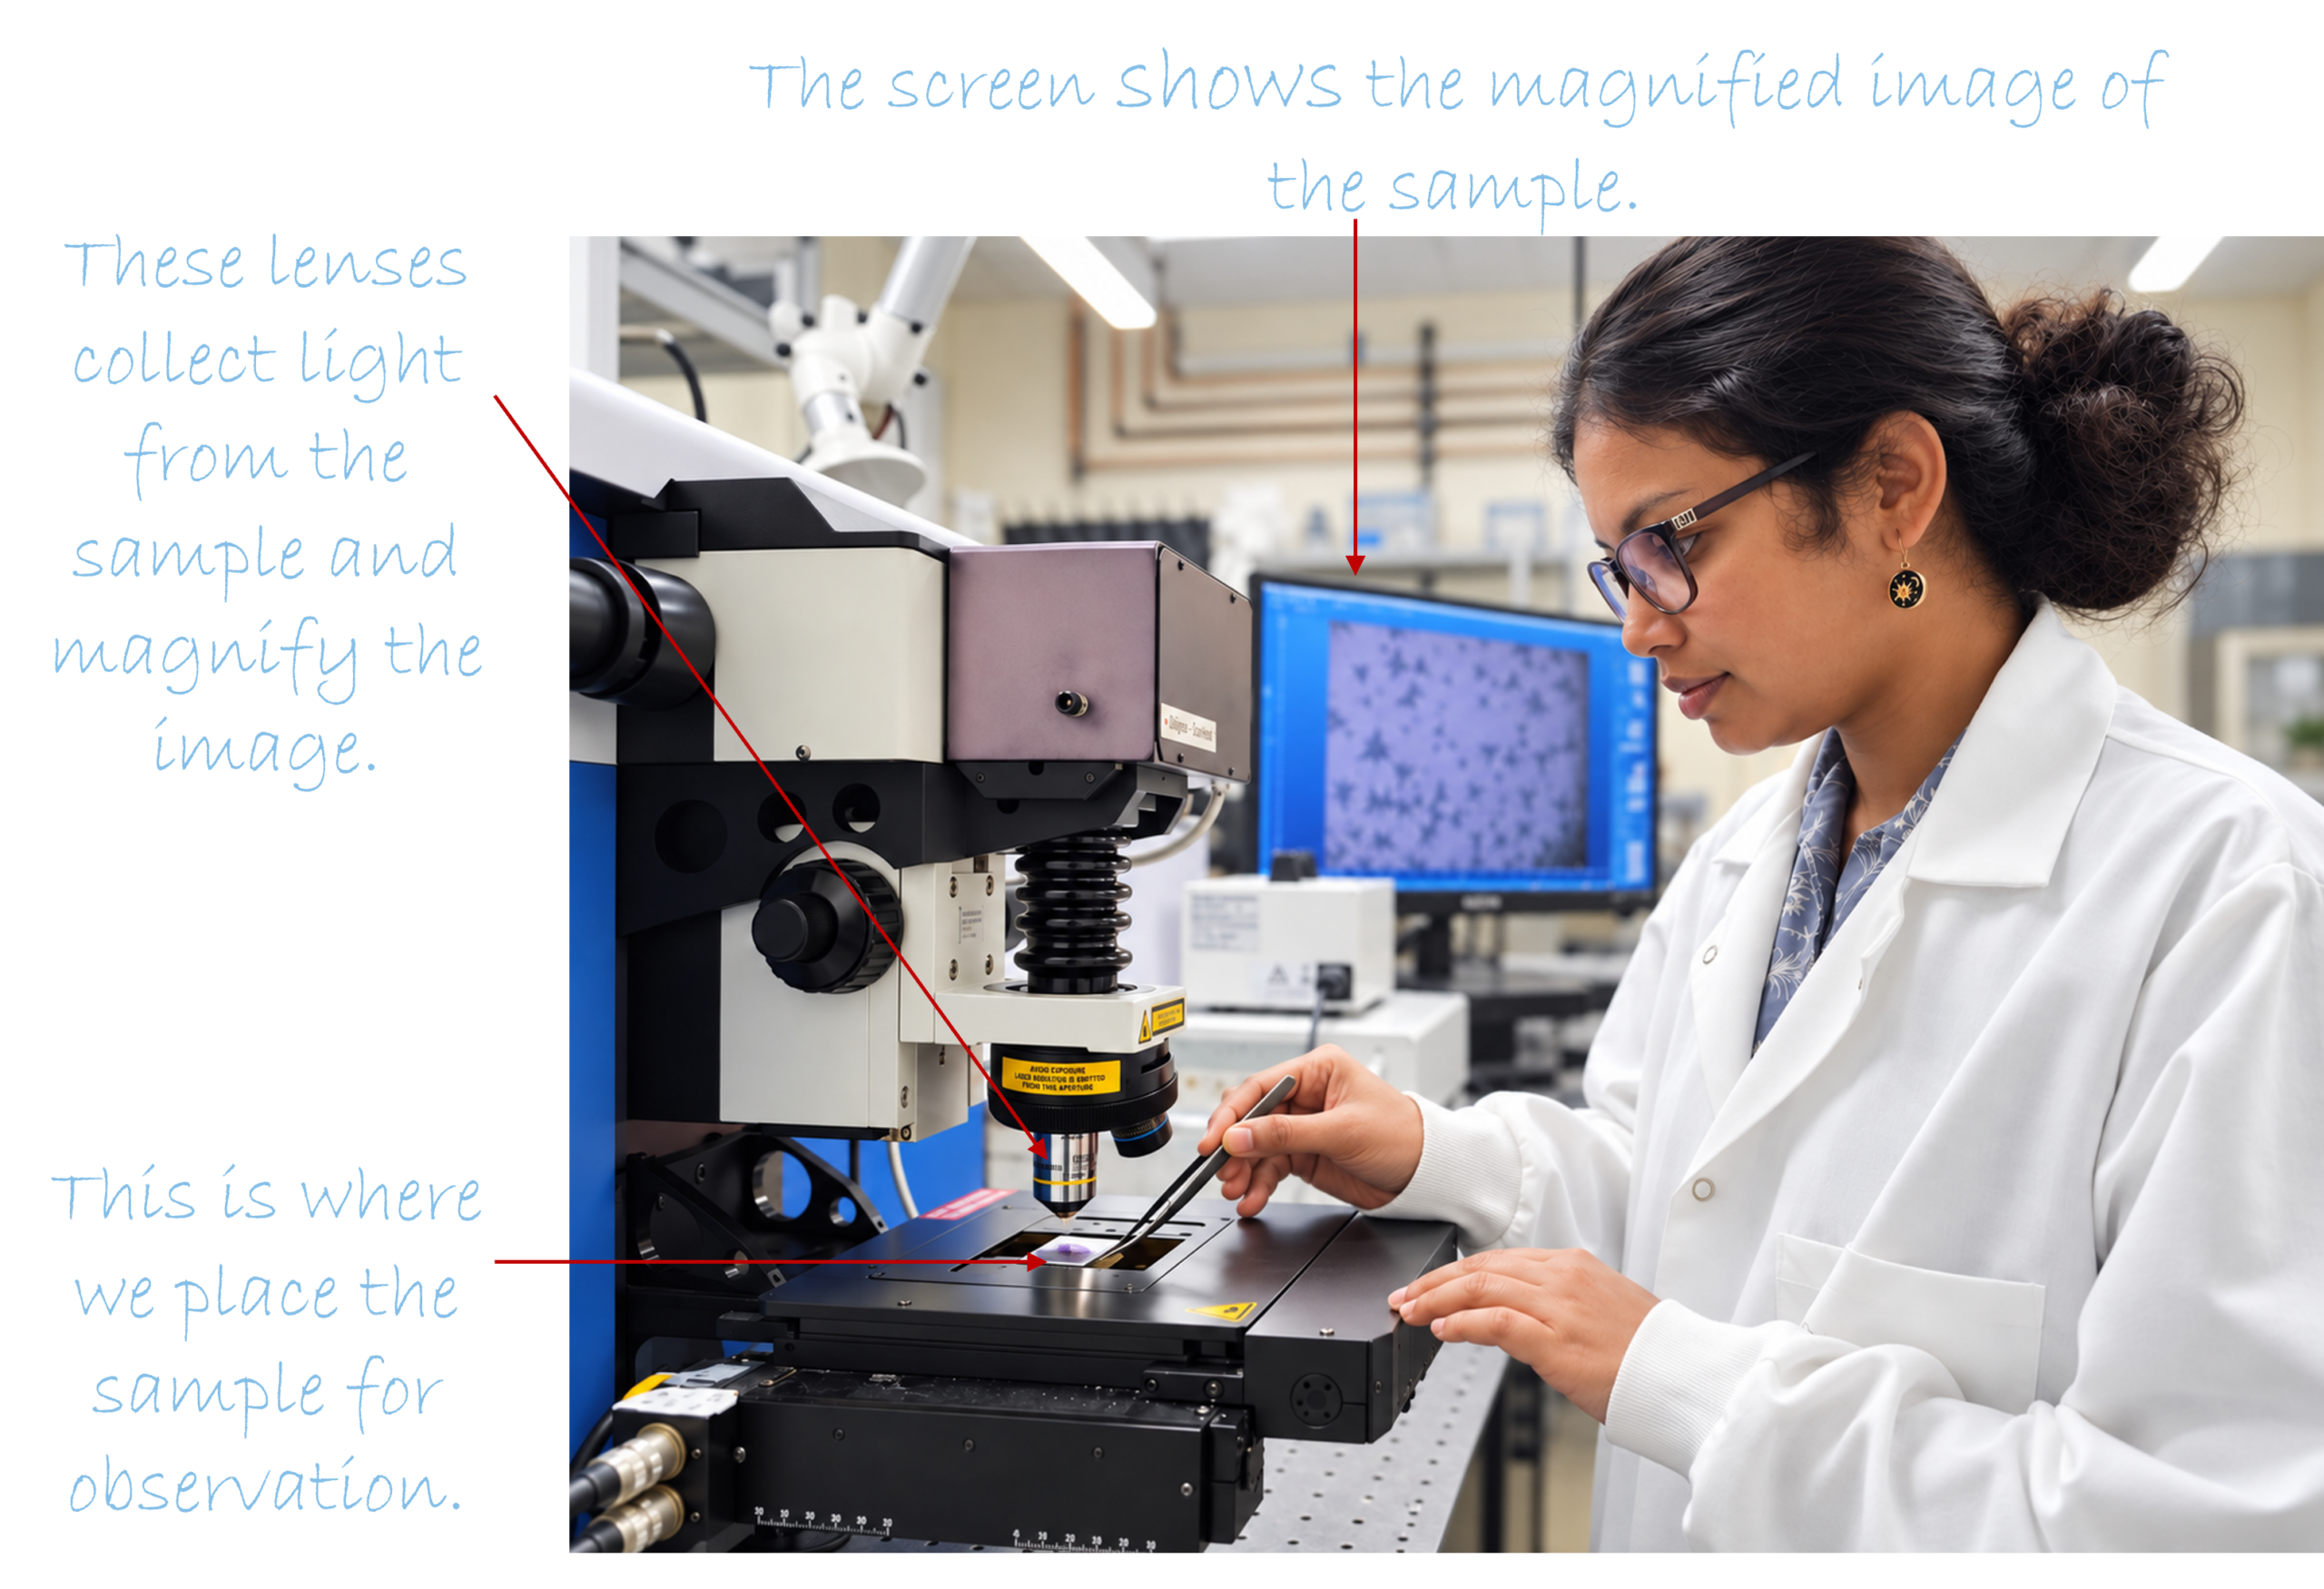
The microscope magnifies the samples up to 100 times, making the tiny triangles easier to see. I compare the shape, color, and uniformity of each sample before deciding which one to study with a laser.
Let’s look at images of several samples together.
Sample 1
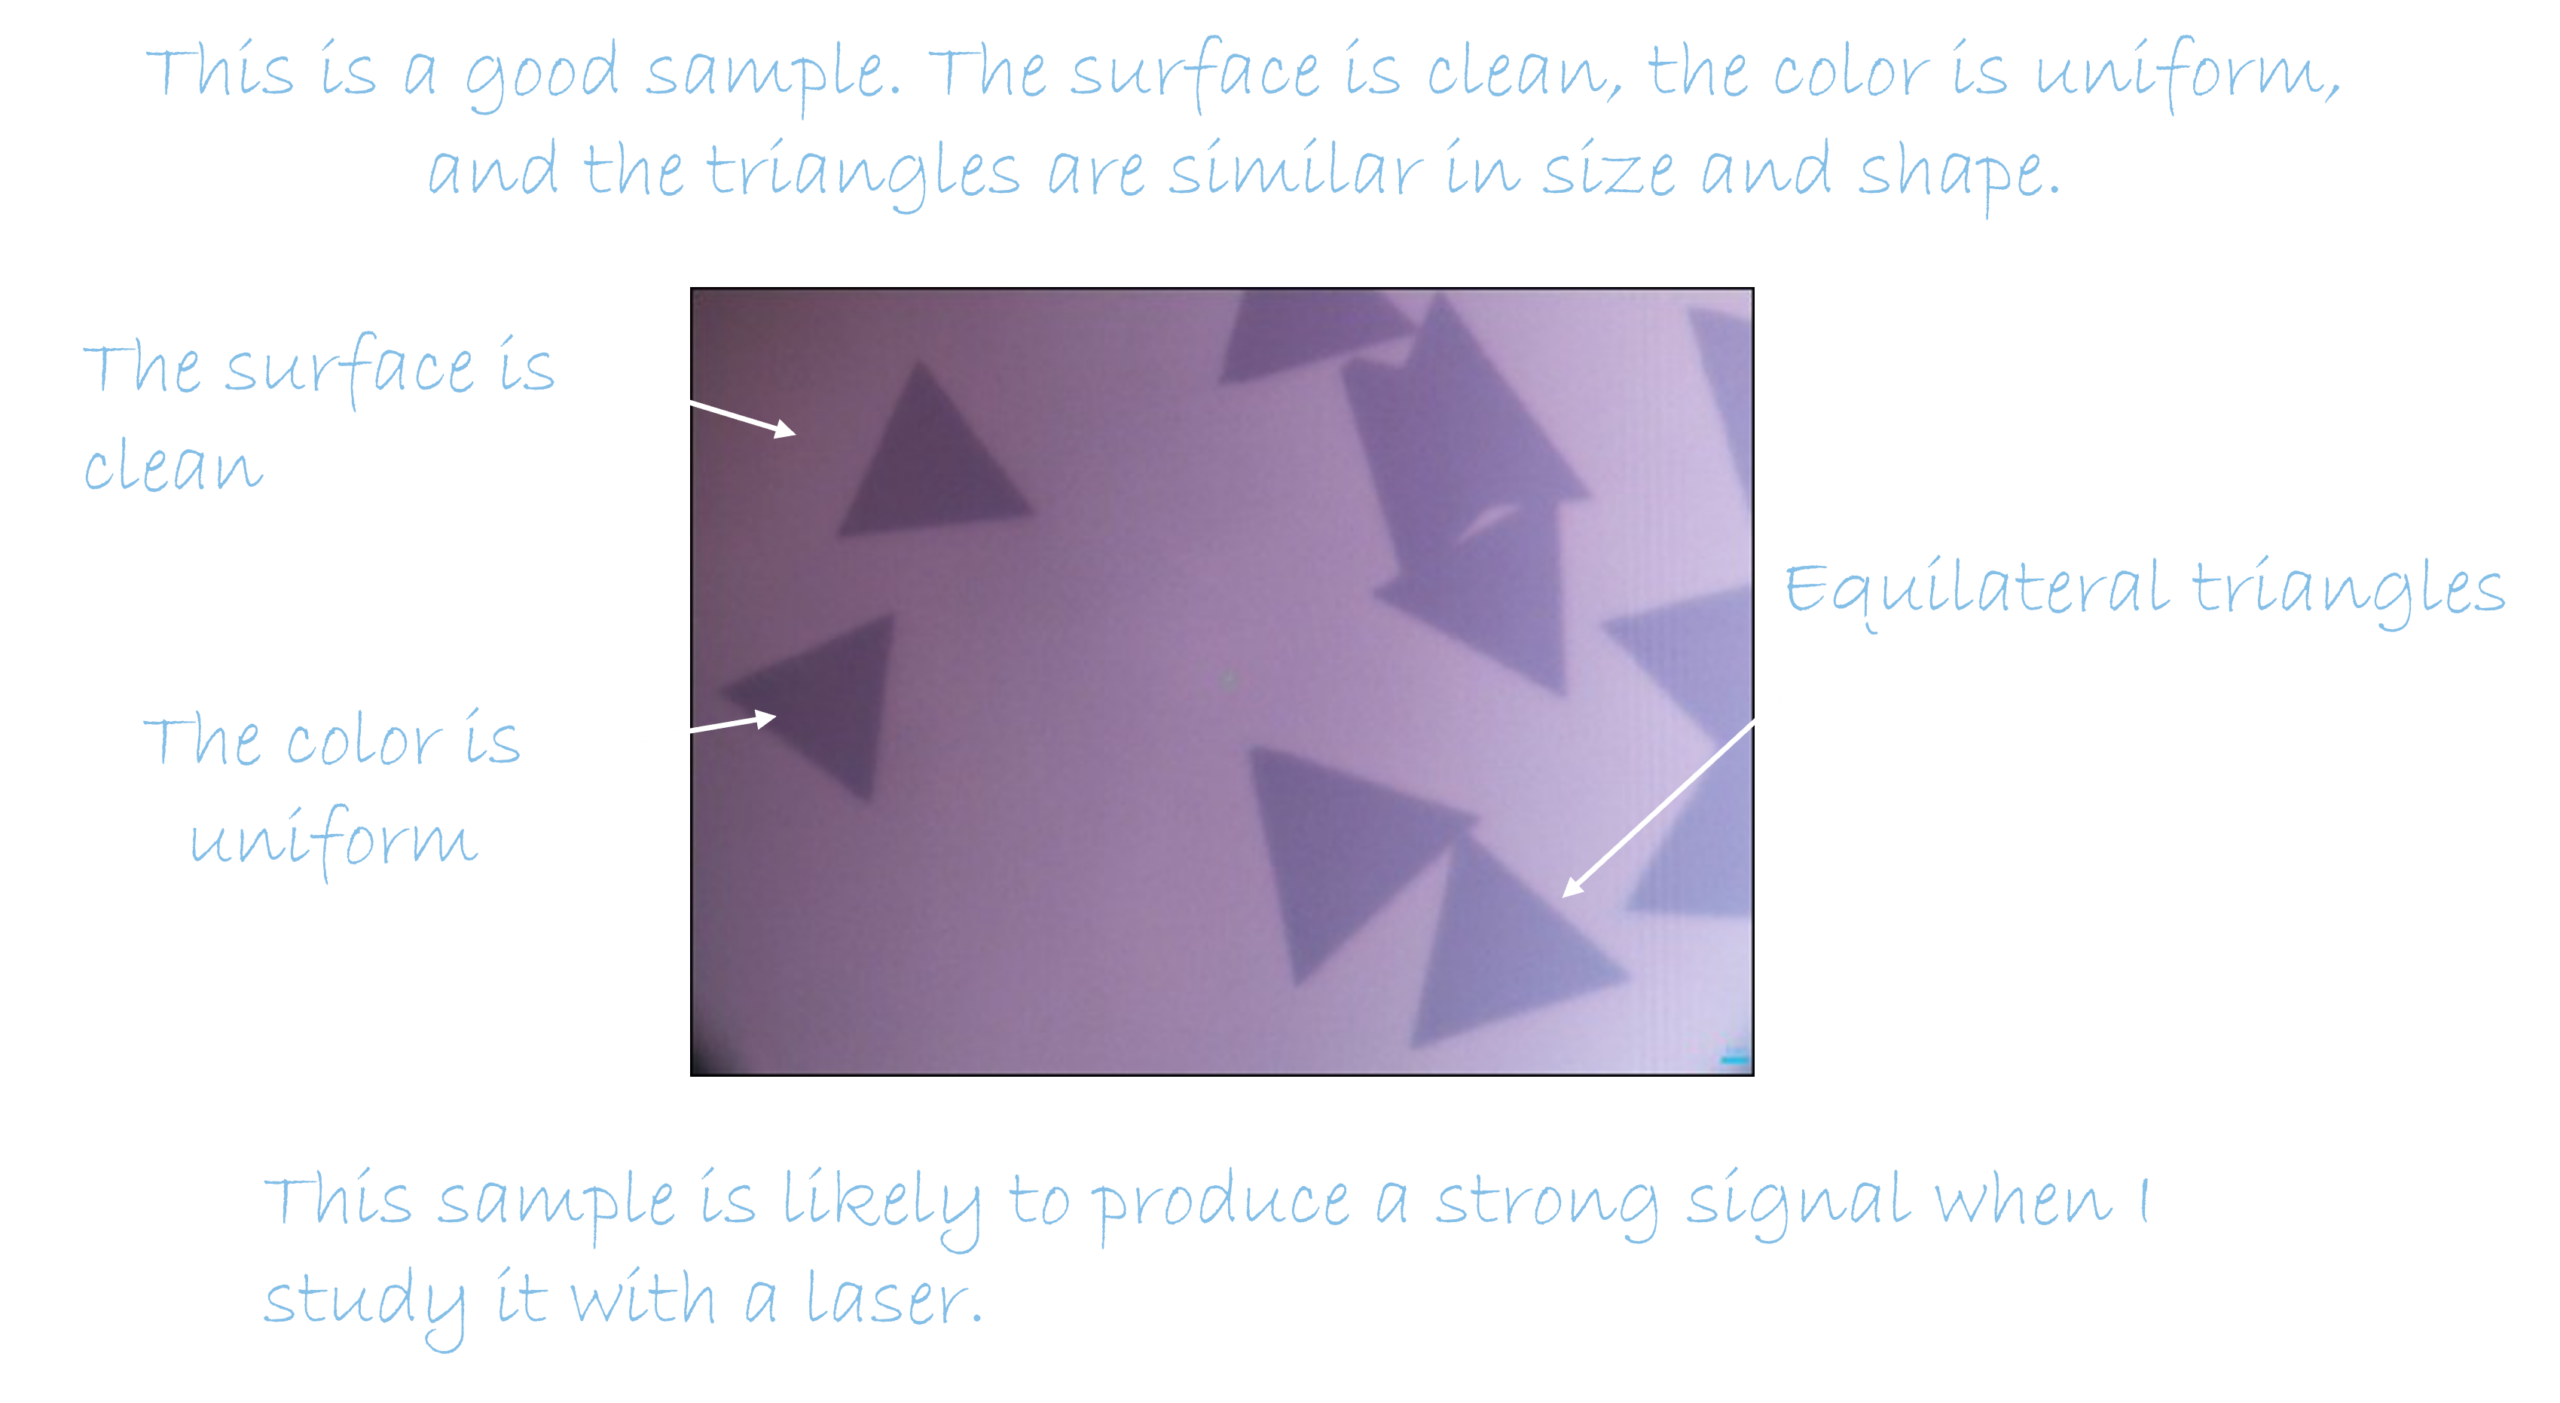
Sample 2
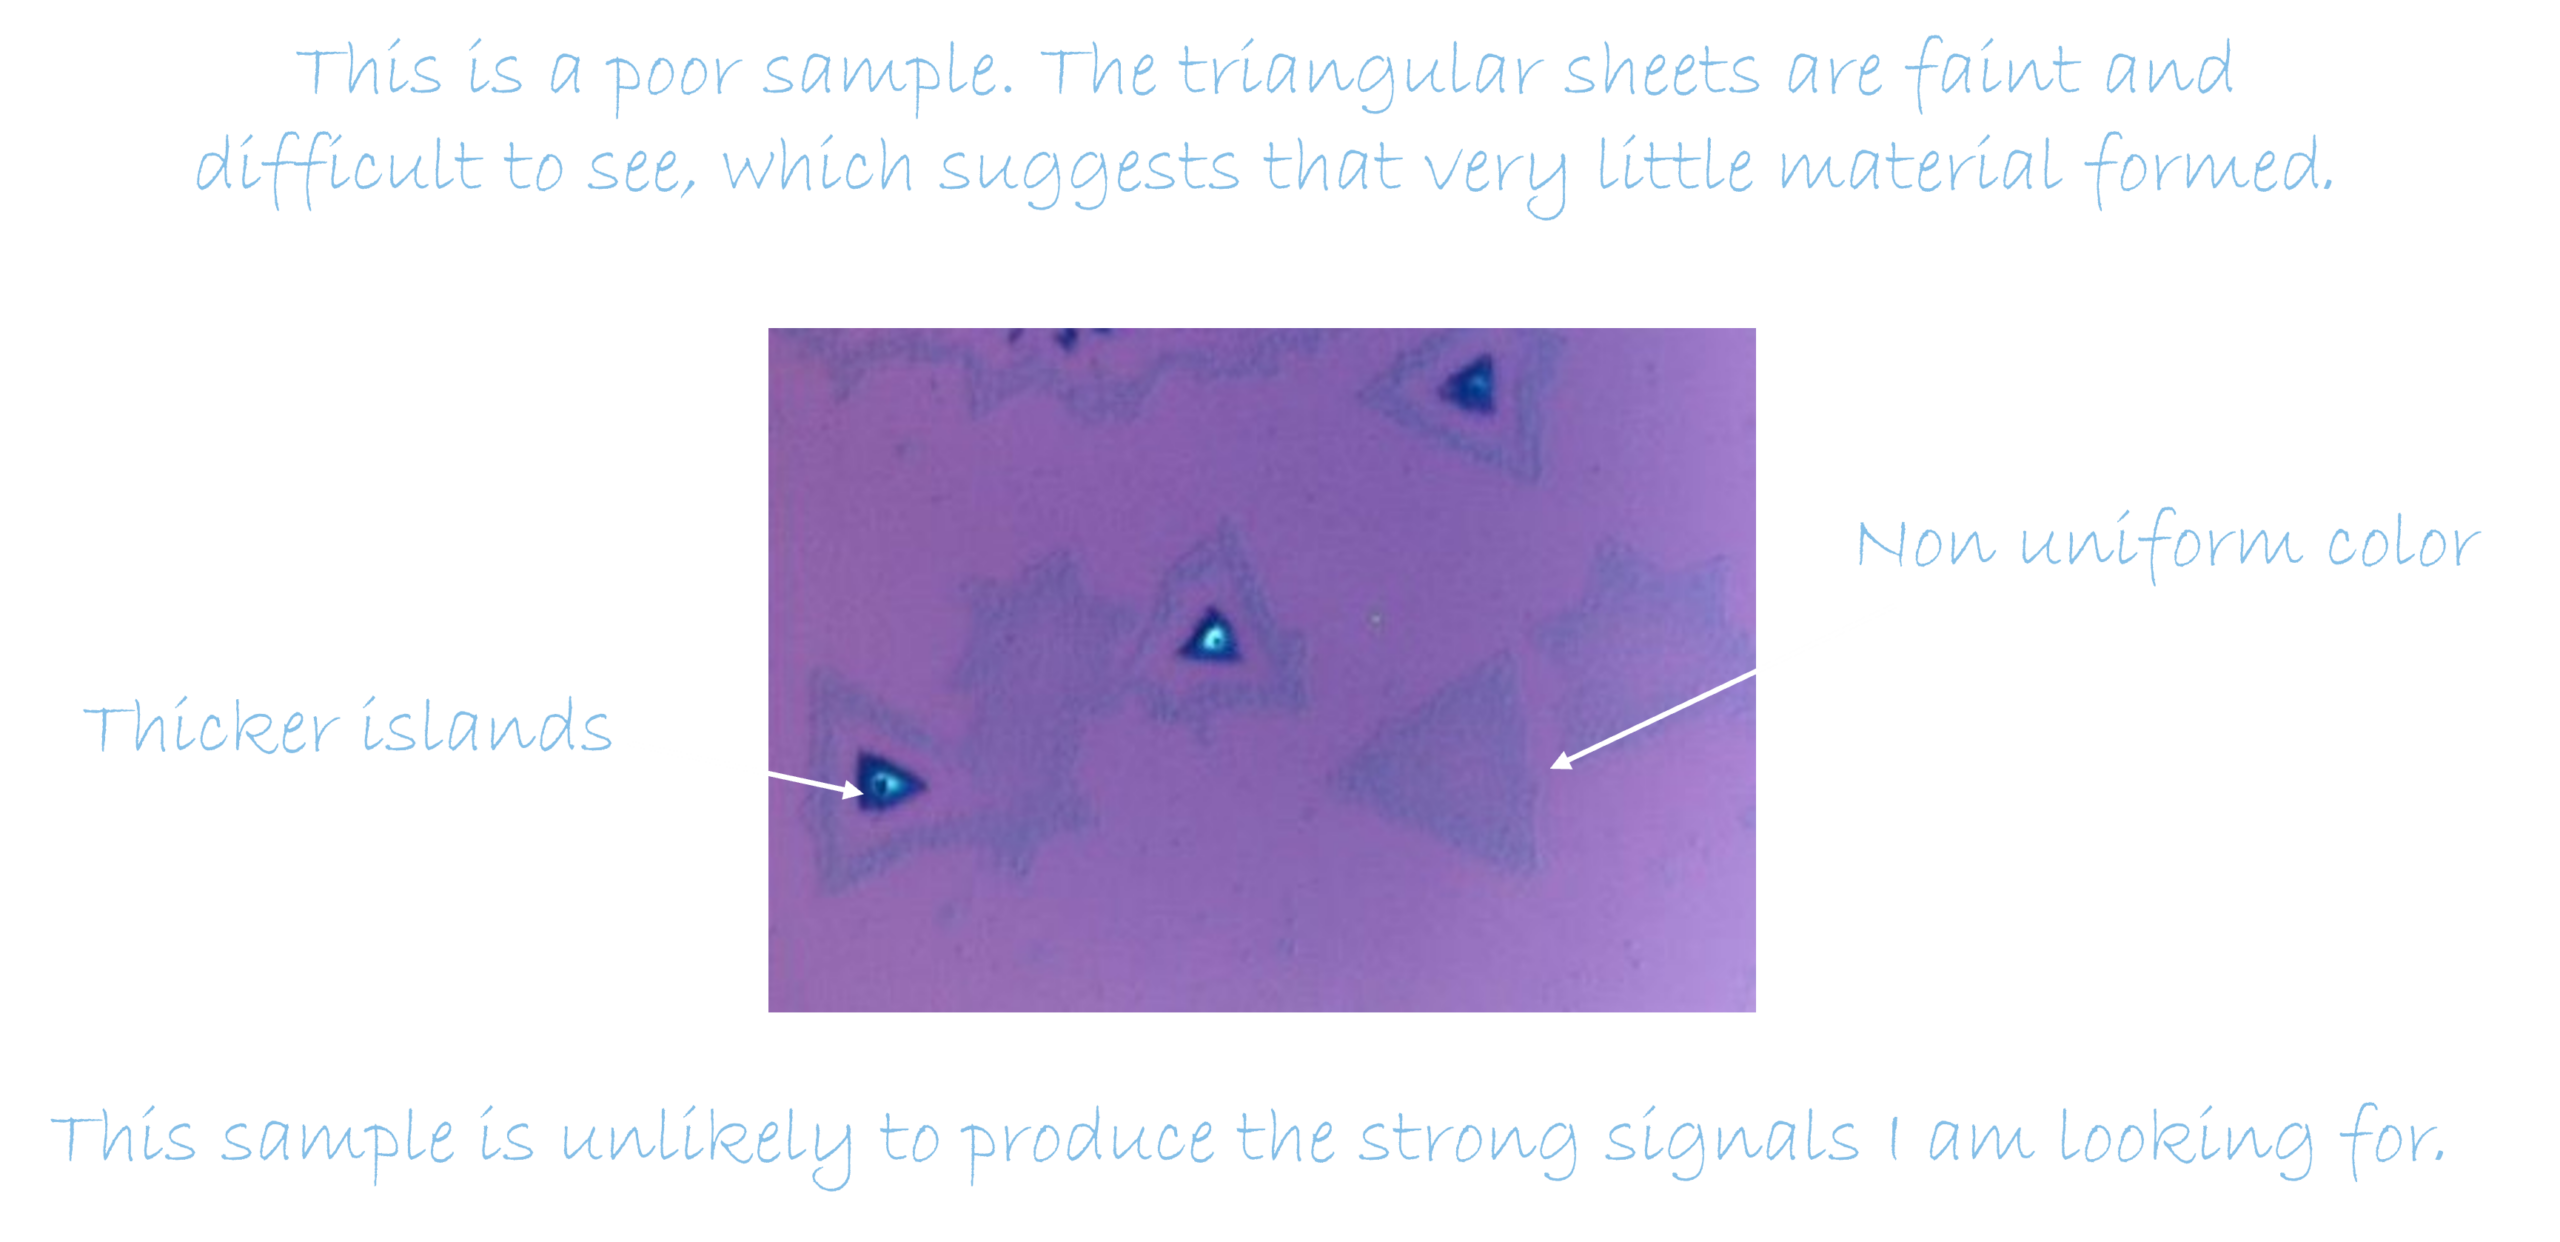
Sample 3
Section 4
Shine Light, Read the Properties
Probing TMD sheets with different lasers

After growing a TMD sheet, I get to see it under a microscope and examine my tiny triangles. But their shape does not tell me the whole story.
Did I grow a high-quality material I wanted? Is the sheet thin enough to be used in small electronic devices? Is it damaged or stretched? Can it produce intense optical signals?
To answer these questions, I use a technique called spectroscopy, which allows me to study a material by observing what happens when it meets light.
You have already seen a simple example of this. When sunlight passes through raindrops, it separates into the colors of a rainbow. Hidden inside what appears to be white light are many different colors.

Light carries clues about everything it touches.
Scientists use instruments to separate and measure light similarly. The pattern we record is called a spectrum. Instead of seeing it as a rainbow in the sky, we display it as a graph on a computer screen.
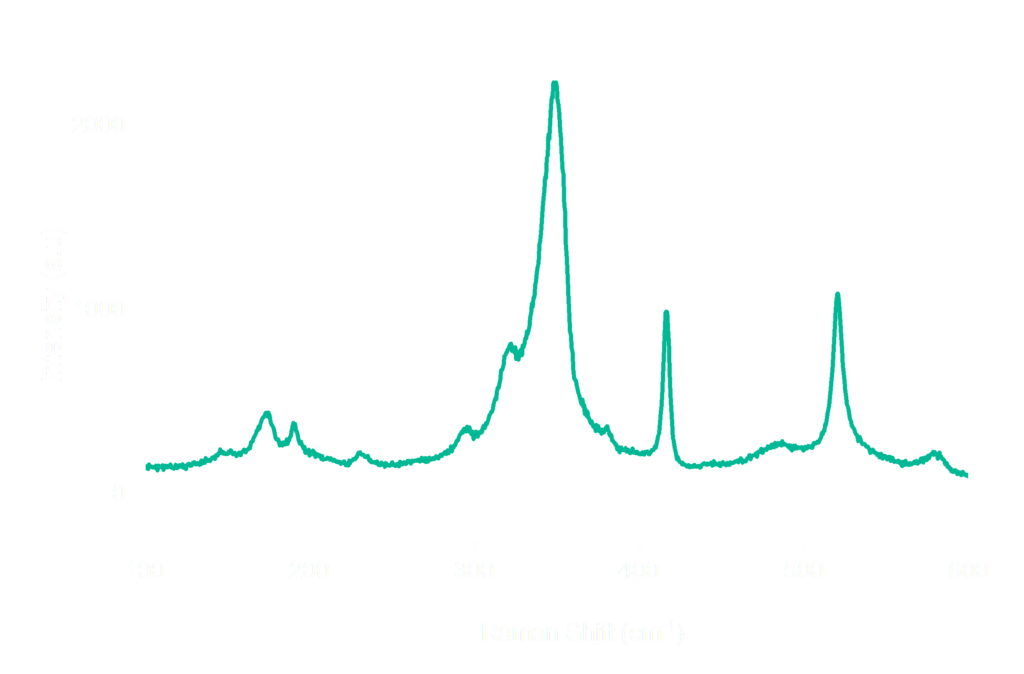
There are hundreds of spectroscopy techniques, and each one reveals a different part of the story.
For my TMD sheets, I use two techniques: Raman spectroscopy and Photoluminescence spectroscopy.
Both experiments begin in almost the same way. I shine a laser onto the sheet and collect the light coming from it. However, the two techniques listen to different messages hidden in that light.
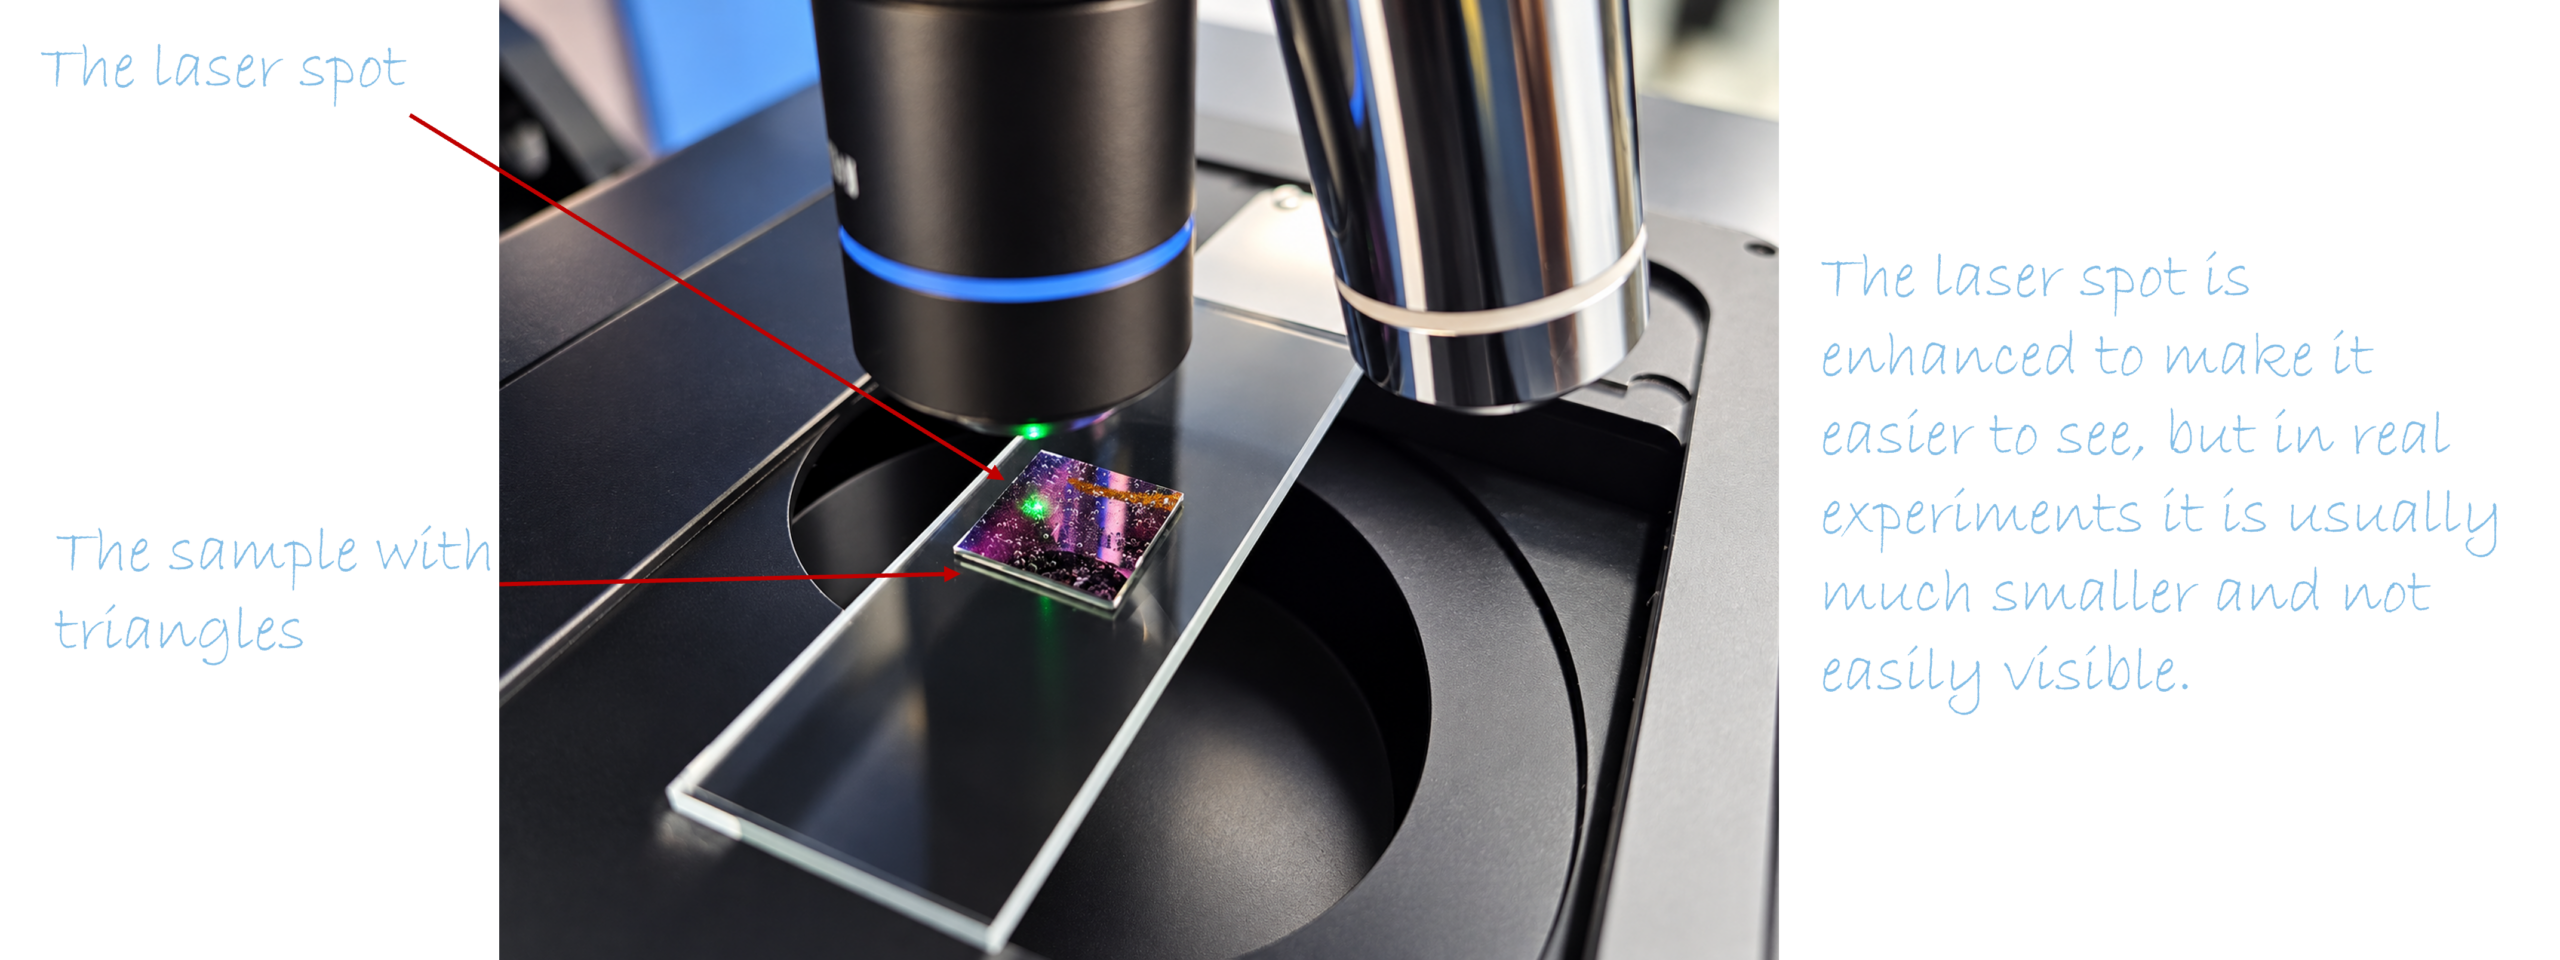
Raman spectroscopy is about observing the atoms dance.
Even though a TMD sheet may look perfectly still, its atoms are always moving. They vibrate together in tiny patterns, almost like dancers following different rhythms.


When laser light meets the sheet, a very small amount of that light exchanges energy with these vibrations. Raman spectroscopy allows me to detect this change.
The result is a pattern of peaks that acts like the material’s vibrational identity, or dance pattern.
By reading this vibrational identity, I can look for clues about the sheet. Are the atoms arranged as expected? Did I produce the chemical composition and crystal structure I wanted?
In a nutshell, Raman spectroscopy helps me determine whether I actually grew the material I intended.
Photoluminescence tells me another part of the story. It is about watching the sheet glow.
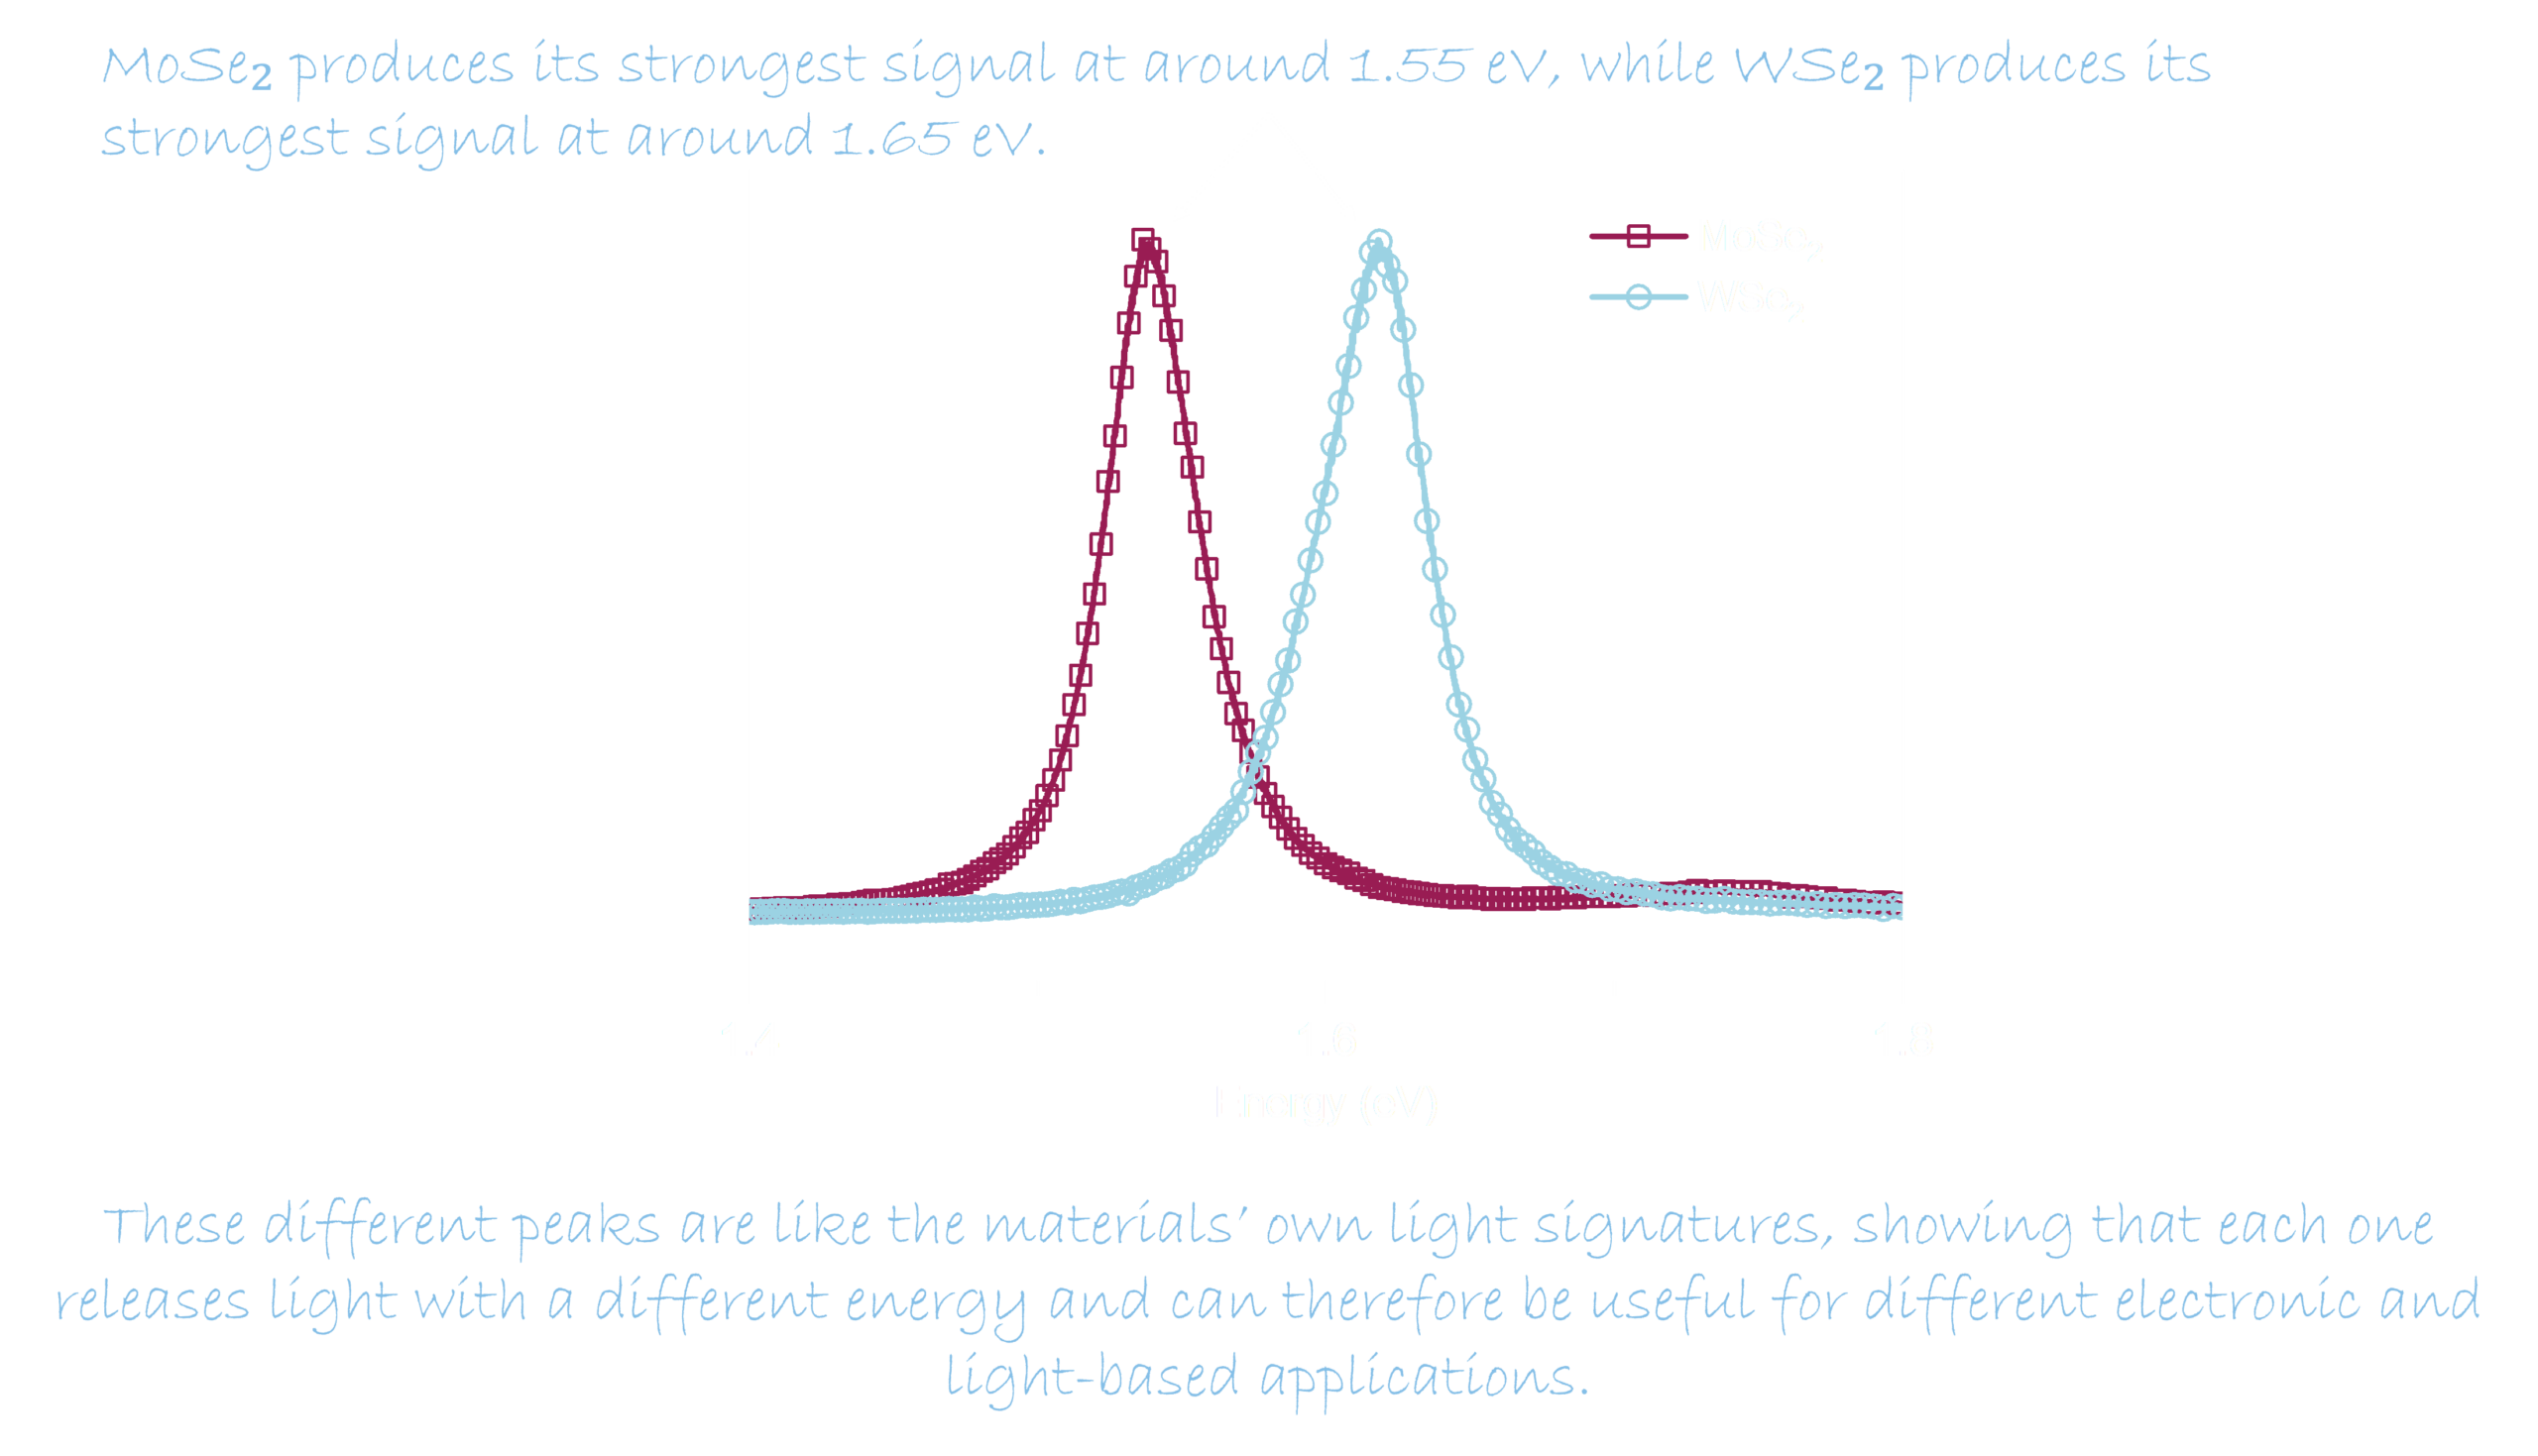
When I shine a laser onto the TMD sheet, the material absorbs some of the light’s energy. A moment later, it may release part of that energy as new light. This tiny glow is called photoluminescence.

The glow is too faint for our eyes to see, but my instruments can detect it. Its color, strength, and shape tell me how the sheet interacts with light. Photoluminescence spectroscopy is like asking the sheet, “What happens after you absorb light?”
For these applications, the sheet must absorb and release energy in a useful and predictable way. A clear, strong glow can be an encouraging sign that the material releases light efficiently. If the glow becomes weaker, changes color, or varies across the sheet, it gives me clues that the sheet’s thickness, strain, defects, contamination, or surroundings may have changed.
Detecting the glow from these triangles is especially important because we hope to use atom-thin materials in light-based technologies. In the future, TMD sheets could help create light-activated switches so thin that we might barely notice them woven into our clothes. They could also contribute to flexible displays that bend or roll almost like a sheet of paper.
In a nutshell, Raman spectroscopy and photoluminescence spectroscopy begin with the same laser, but they answer different questions.
Raman tells me how the atoms vibrate.
Photoluminescence tells me how the sheet absorbs energy and gives some of it back as light.
Both methods allow me to explore an incredibly thin sheet without cutting or damaging it. Isn’t that wonderful?
Section 5
Reading the Spectra
Let’s learn what the spectra tell us
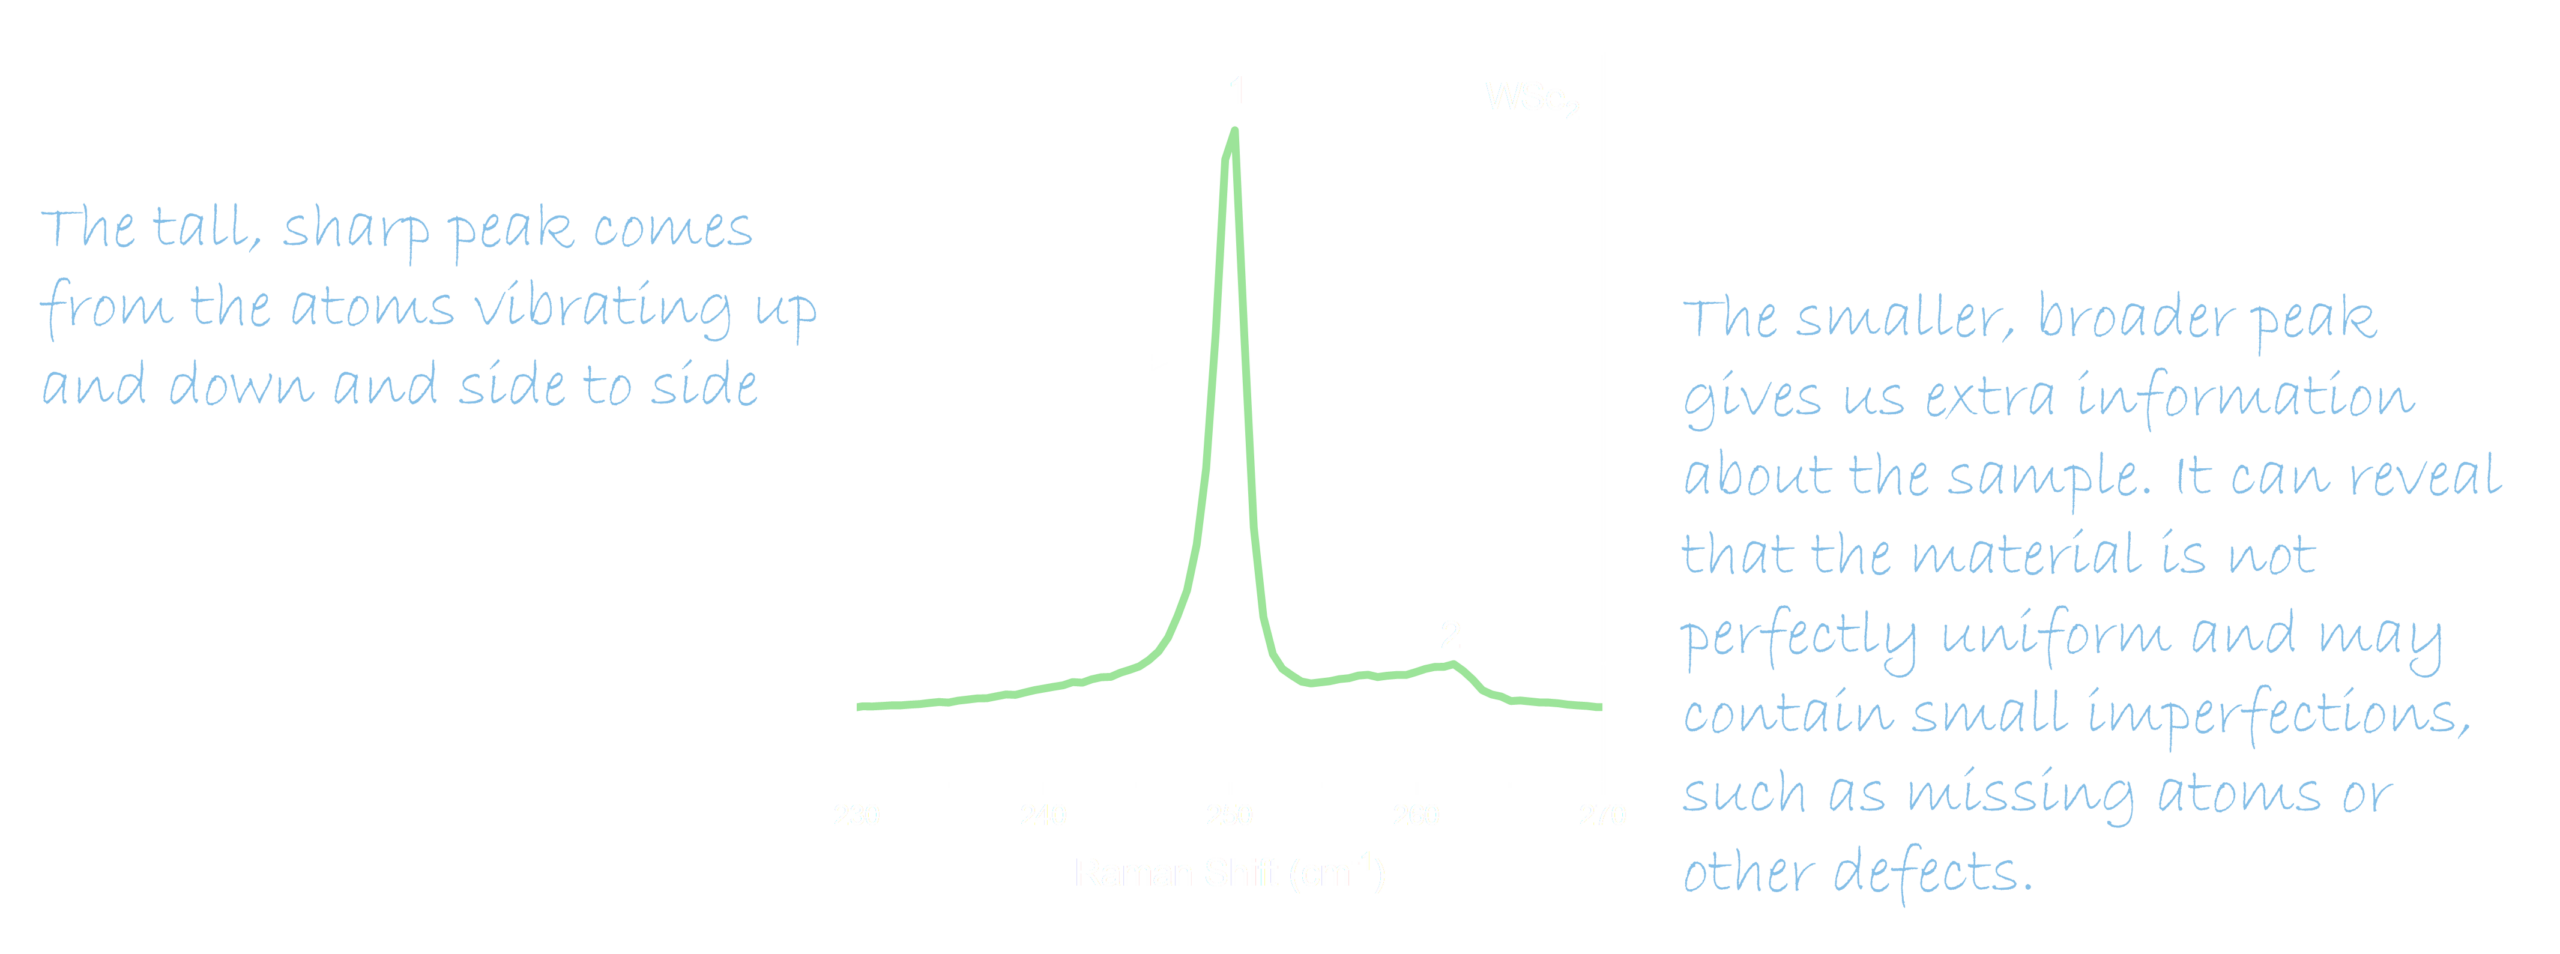
The three spectra & the map below show how the optical signals can differ between different samples, lasers and areas.
Raman Spectrum 1
This is a Raman spectrum of a tiny WSe₂ triangle, made of a metal called tungsten (W) and a chalcogen called selenium (Se). To collect this spectrum, I shine green light from a 532 nm laser onto the triangle and record how the light changes after interacting with the material.
Raman Spectrum 2
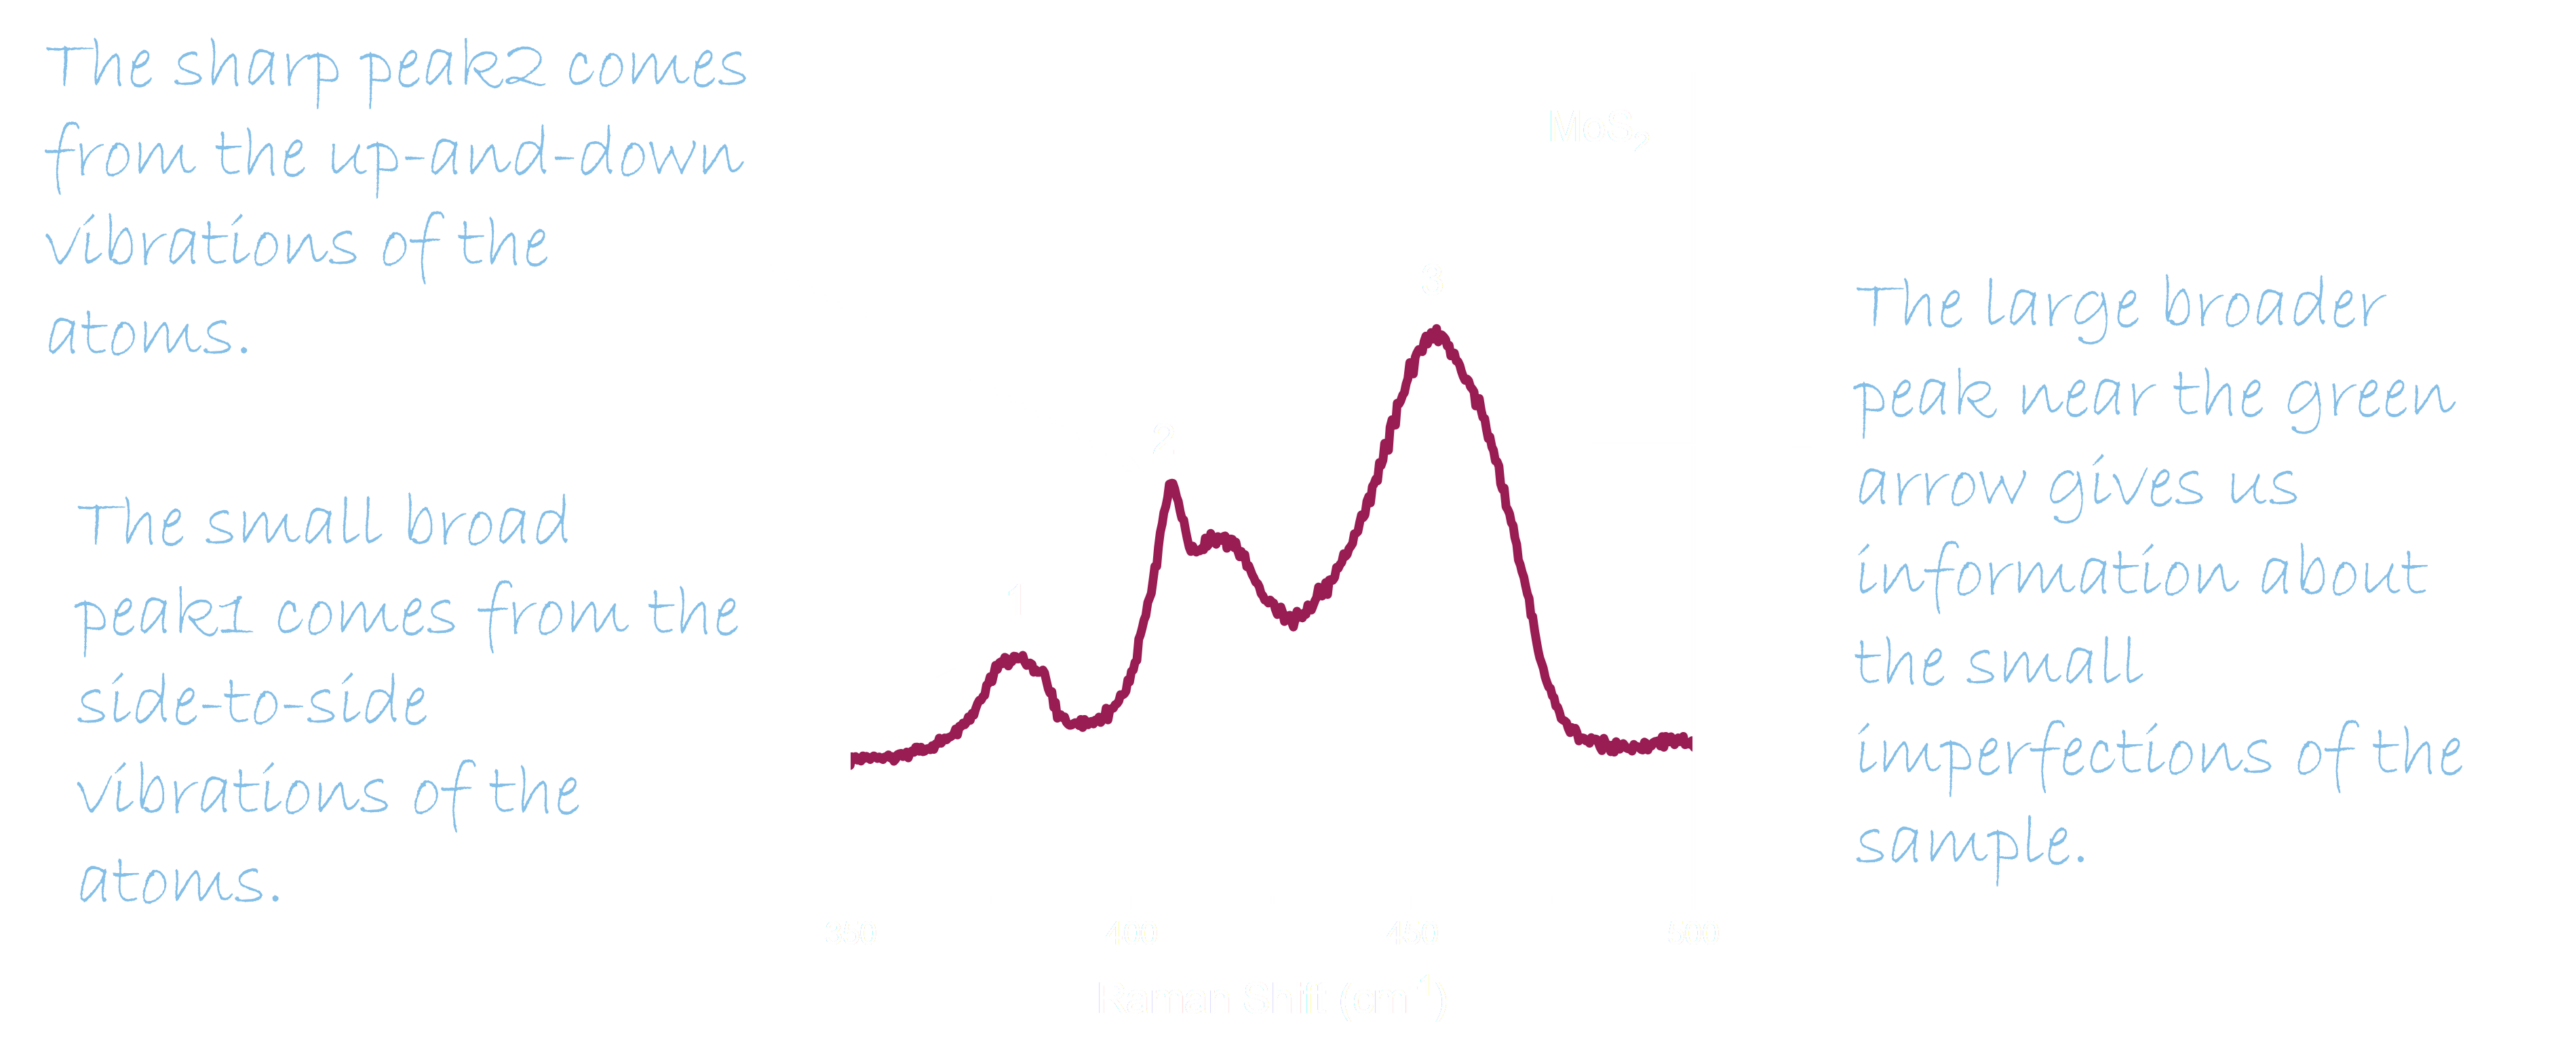
This is a Raman spectrum of a tiny MoS₂ triangle composed of tungsten (Mo) and sulfur (S) atoms. To collect this spectrum, I shine red light from a 633 nm laser onto the triangle.
You can see many features in the spectrum.
Photoluminescence Spectra
Mapping the Material’s Glow
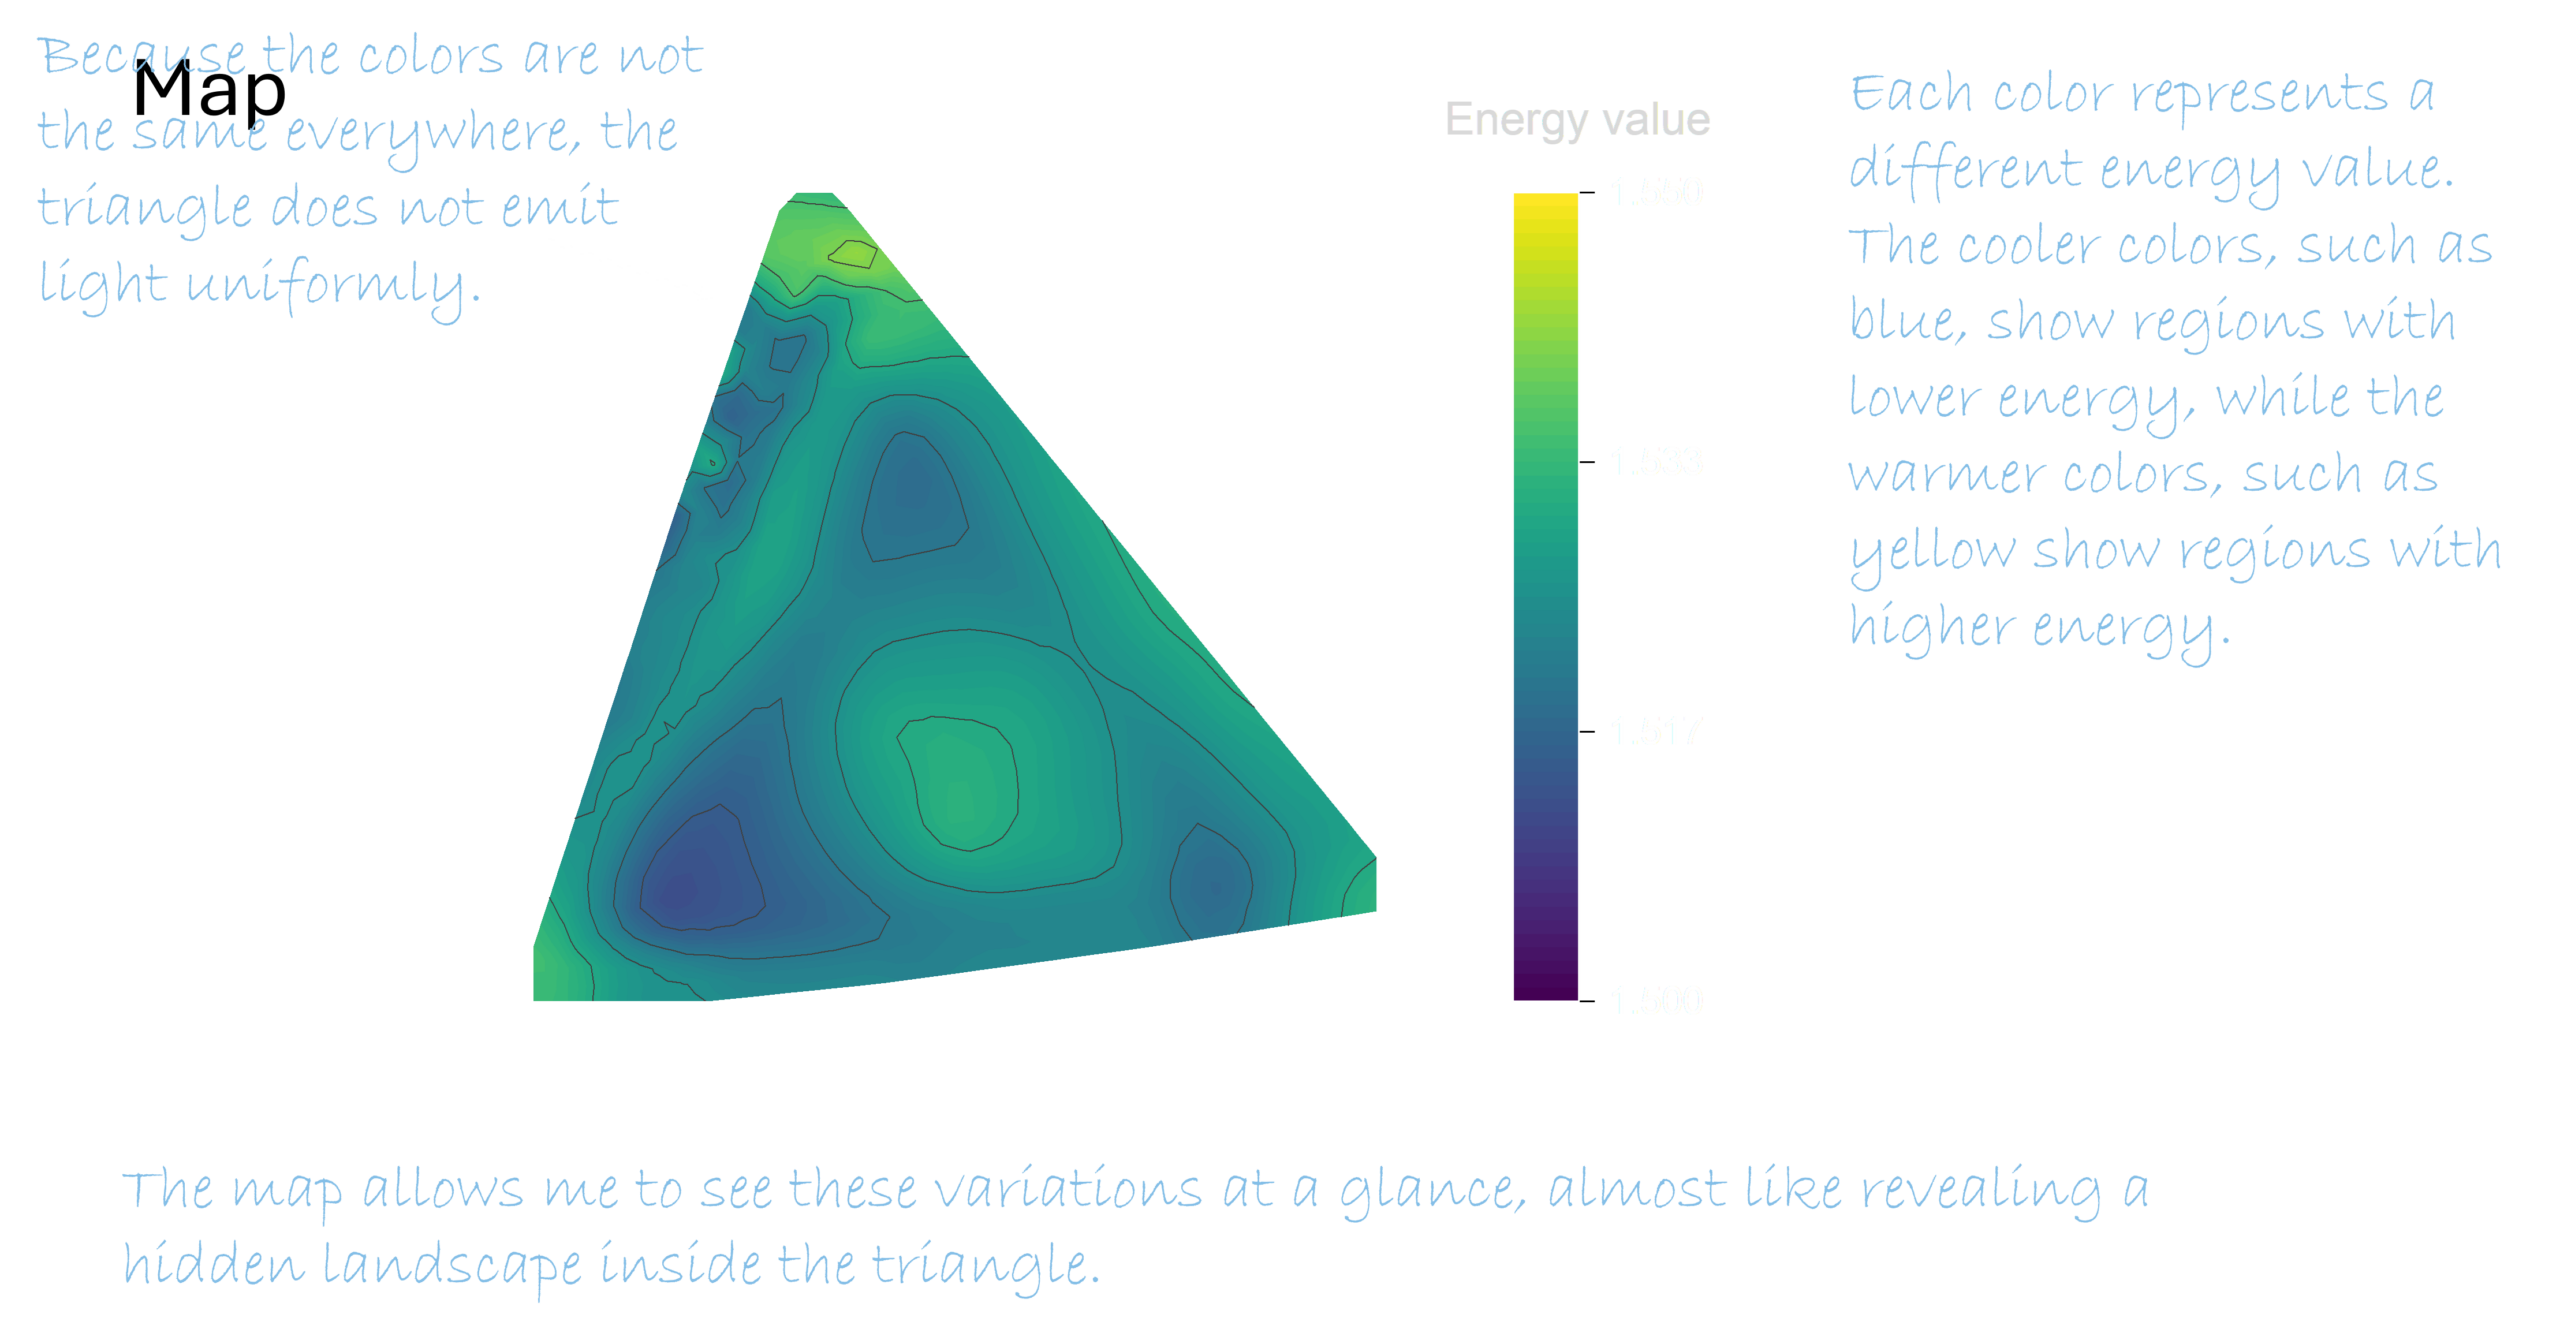
A single spectrum tells us how one small spot on the sample emits light. But the glow may not be the same across the entire triangle. To see how it changes from place to place, I collect many spectra across the sample and combine them into a color map.
This map helps me see whether the material is uniform or whether different regions behave differently.
Section 6
Lab Workflow
How I spend my day
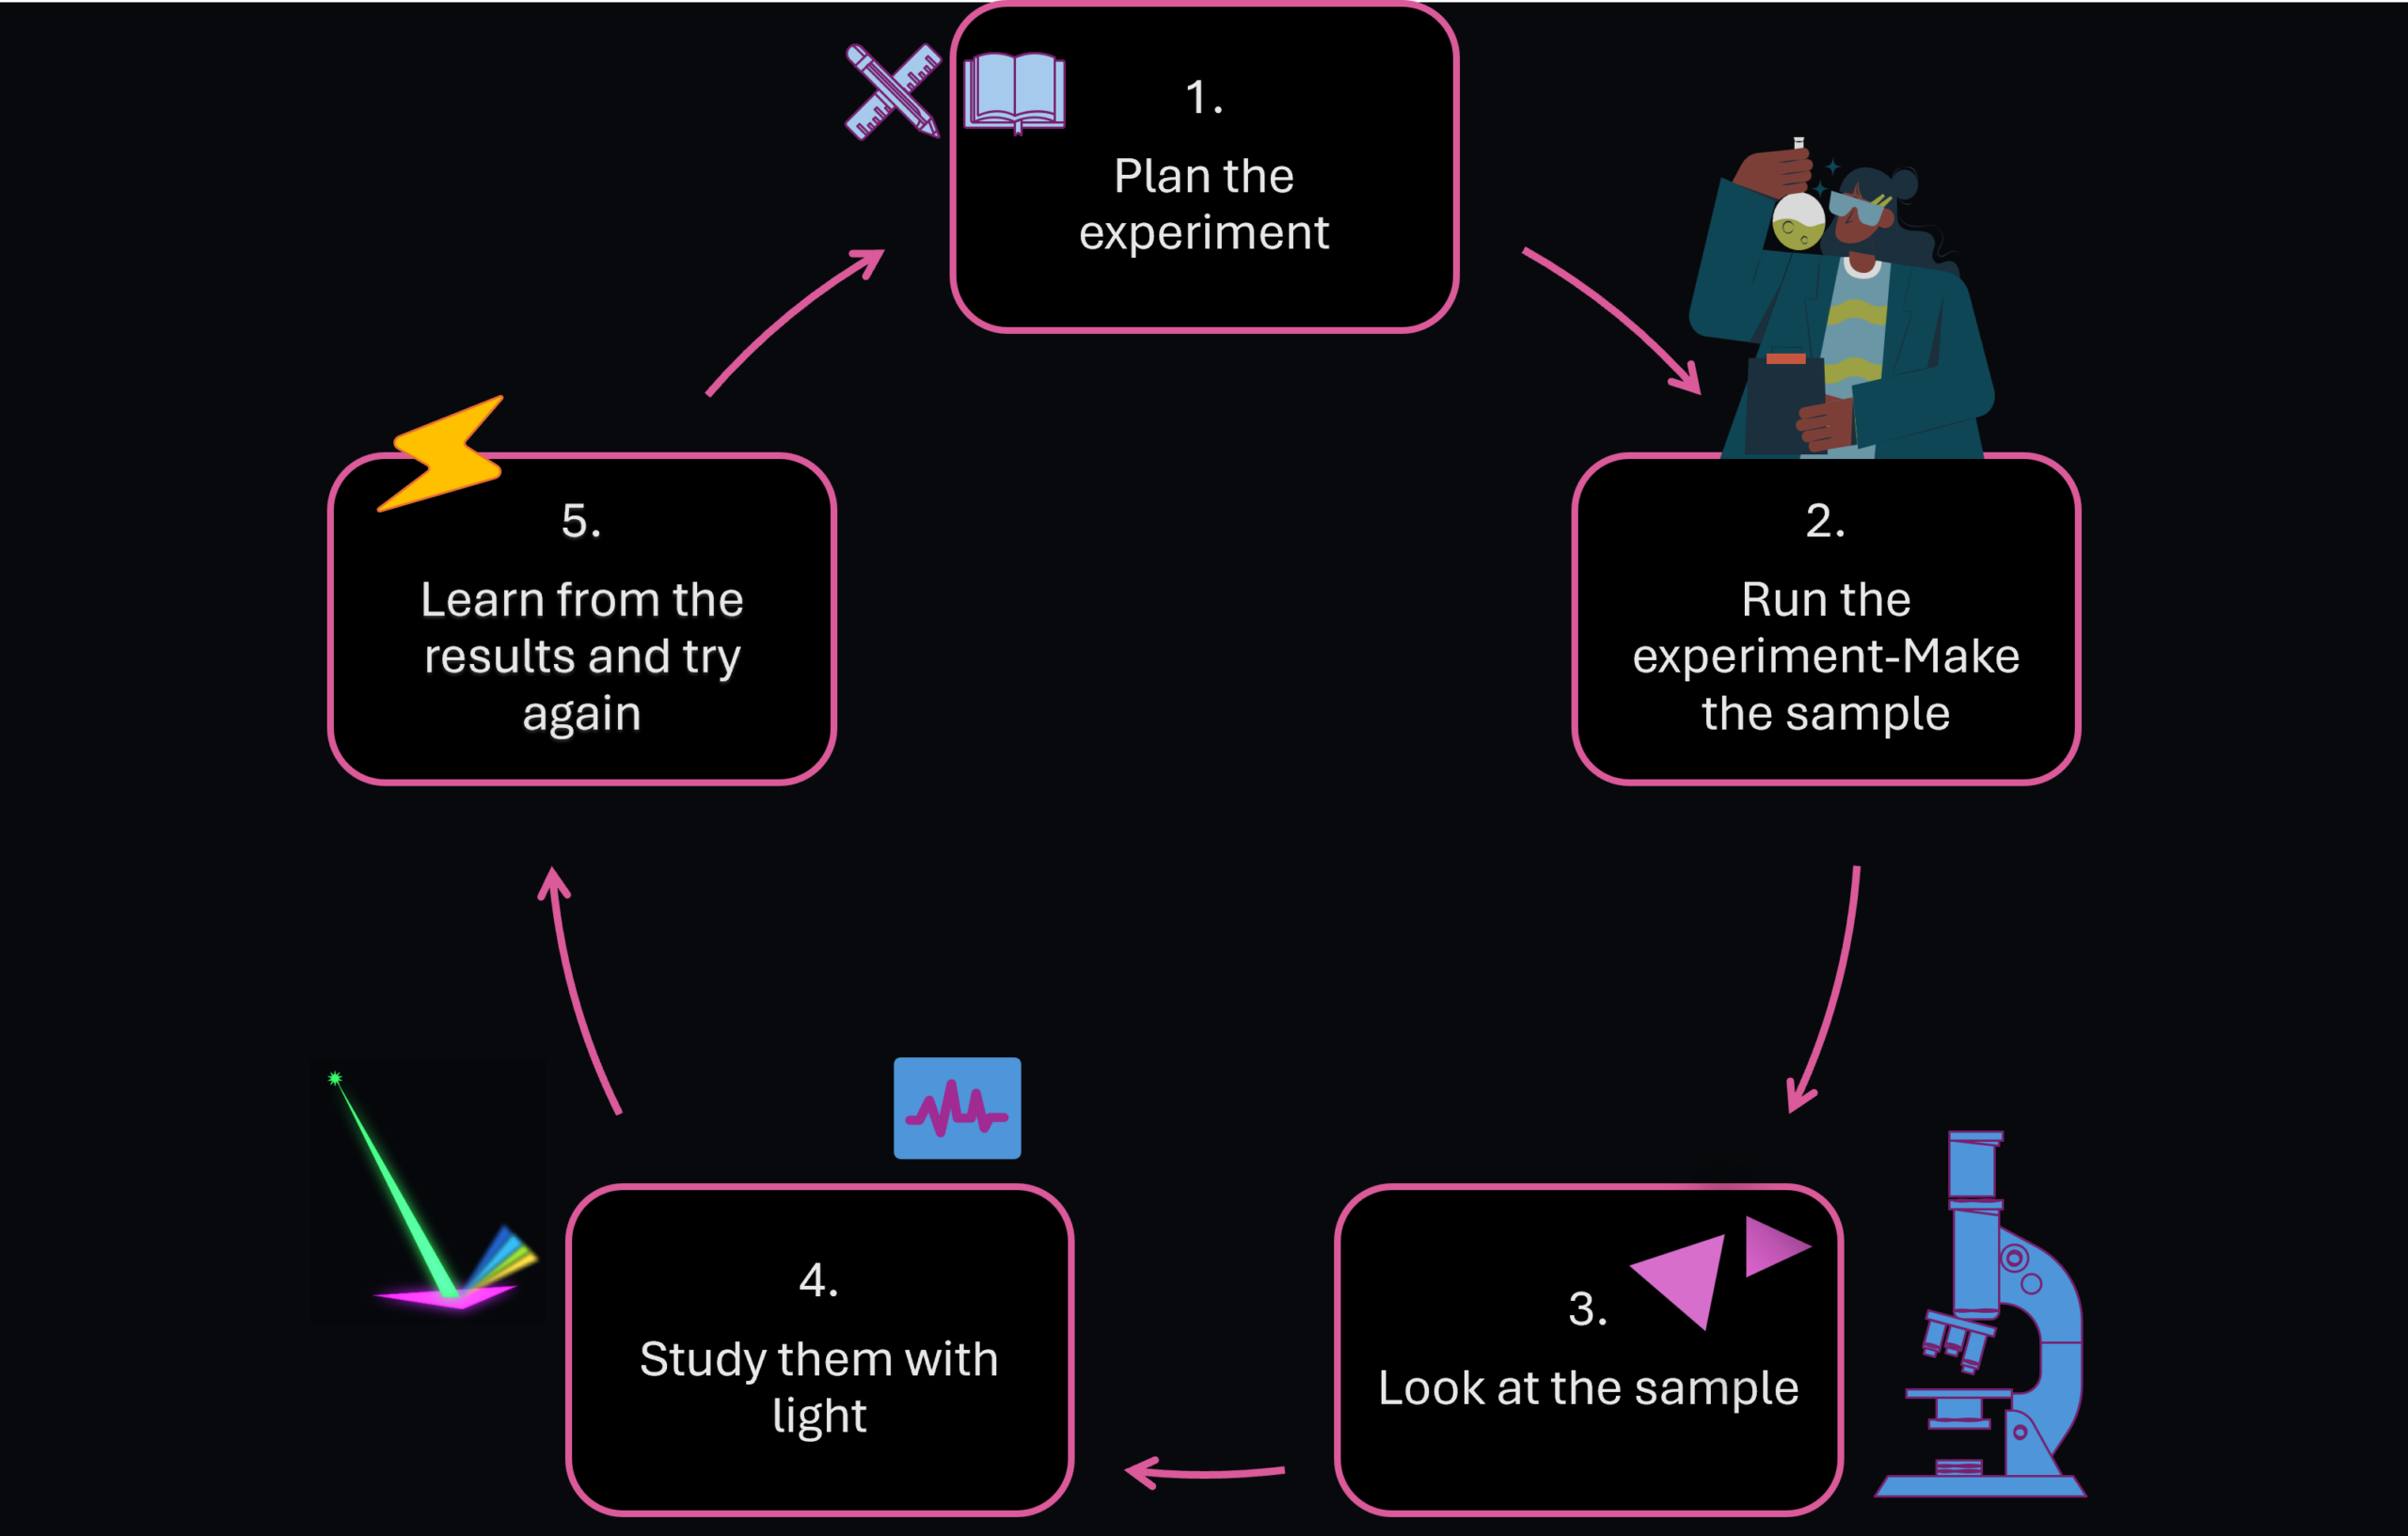
Here’s a look at how I go through my research, from start to finish. I begin by planning an experiment, then grow the samples and examine them under a microscope. Next, I use Raman spectroscopy and photoluminescence to study how the samples interact with light.
After using these methods on my teeny-tiny triangles, I ask myself:
- Did I grow the material I intended to grow?
- Is the sheet thin and uniform?
- Has it been stretched, damaged, or changed?
- Does it interact with light in a useful way?
- Did my latest experiment make the sheet better?
Finally, I review the results, draw conclusions, and use what I learned to plan the next experiment. Because research is an ongoing process, the cycle then begins again.
Now It’s Your Turn!
You have seen how I use light to uncover the hidden properties of tiny materials. But you do not need an expensive research lab to start exploring light yourself.
Build Your Own Spectrometer
Thank You!

This project was supported by the Digital Scholarship & Communication (DS&C) Fellowship at Binghamton University. I am grateful to my mentor Chelsea Gibson and the team for their guidance, ideas, and support throughout the project.
A special thank you to Professor Ana Laura for her mentorship and continued support of my research.
Back to top